Fig. 8.
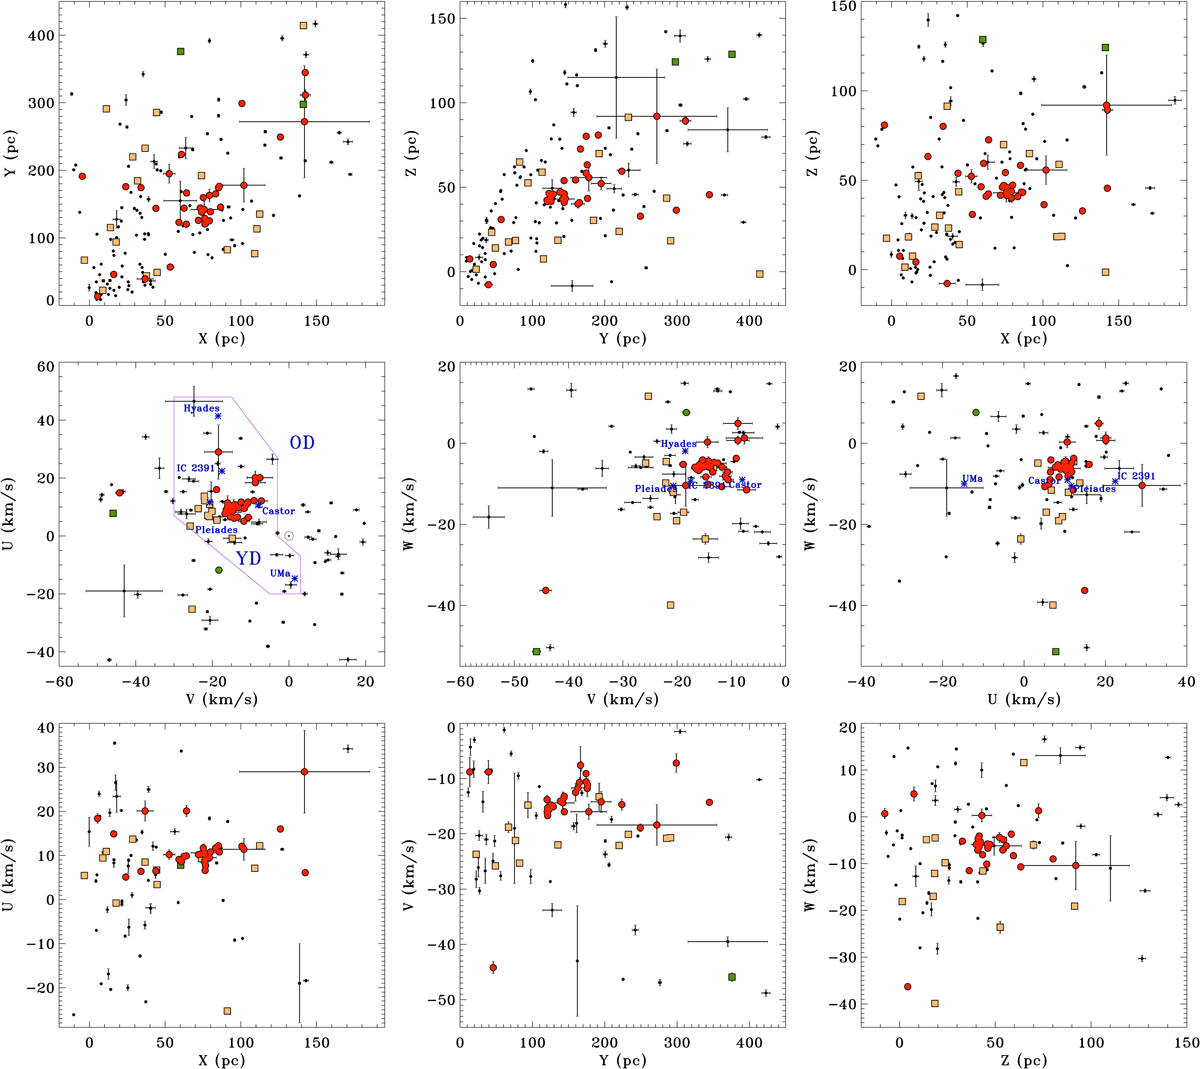
Distribution of our targets in Galactic coordinates (upper panels) and space-velocity components (middle panels), along with the diagram of position versus velocity pointing in a given direction (lower panels). We restricted the parameter ranges on all diagrams to better see the distribution of the youngest sources. We use the same symbols as in Fig. 6. Middle panels: we also display the mean position of the IC 2391 (∼50 Myr) and Hyades (∼600 Myr) superclusters, Pleiades (∼100 Myr) and Castor (∼200 Myr) moving groups, and Ursa Major (UMa) group (∼300 Myr). In the (U, V) plane, the solid line delimits the area of young- and old-disk populations in the solar neighborhood (Eggen 1996).
Current usage metrics show cumulative count of Article Views (full-text article views including HTML views, PDF and ePub downloads, according to the available data) and Abstracts Views on Vision4Press platform.
Data correspond to usage on the plateform after 2015. The current usage metrics is available 48-96 hours after online publication and is updated daily on week days.
Initial download of the metrics may take a while.