Fig. 2.
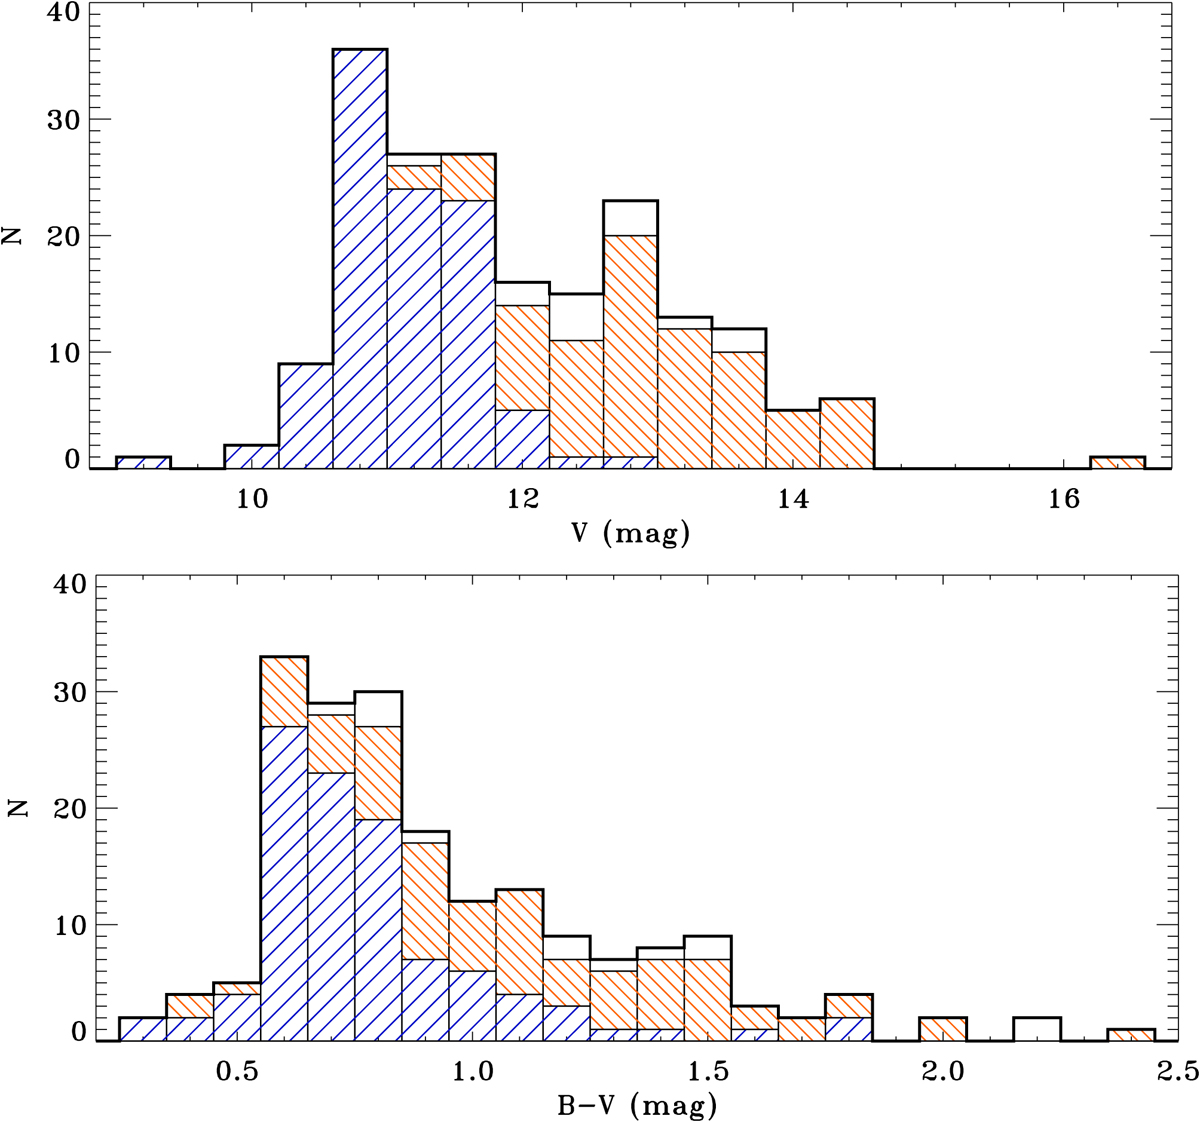
Distributions of V magnitude (upper panel) and B–V color index (lower panel) for our targets. The blue and red stripes correspond to the Tycho and USNO-B1.0 magnitudes converted into the Johnson V magnitudes based on the relations of Høg et al. (2000) and Lépine & Shara (2005), respectively (see text for details). The white areas mark the V photographic (GSC II or YB6) ones.
Current usage metrics show cumulative count of Article Views (full-text article views including HTML views, PDF and ePub downloads, according to the available data) and Abstracts Views on Vision4Press platform.
Data correspond to usage on the plateform after 2015. The current usage metrics is available 48-96 hours after online publication and is updated daily on week days.
Initial download of the metrics may take a while.