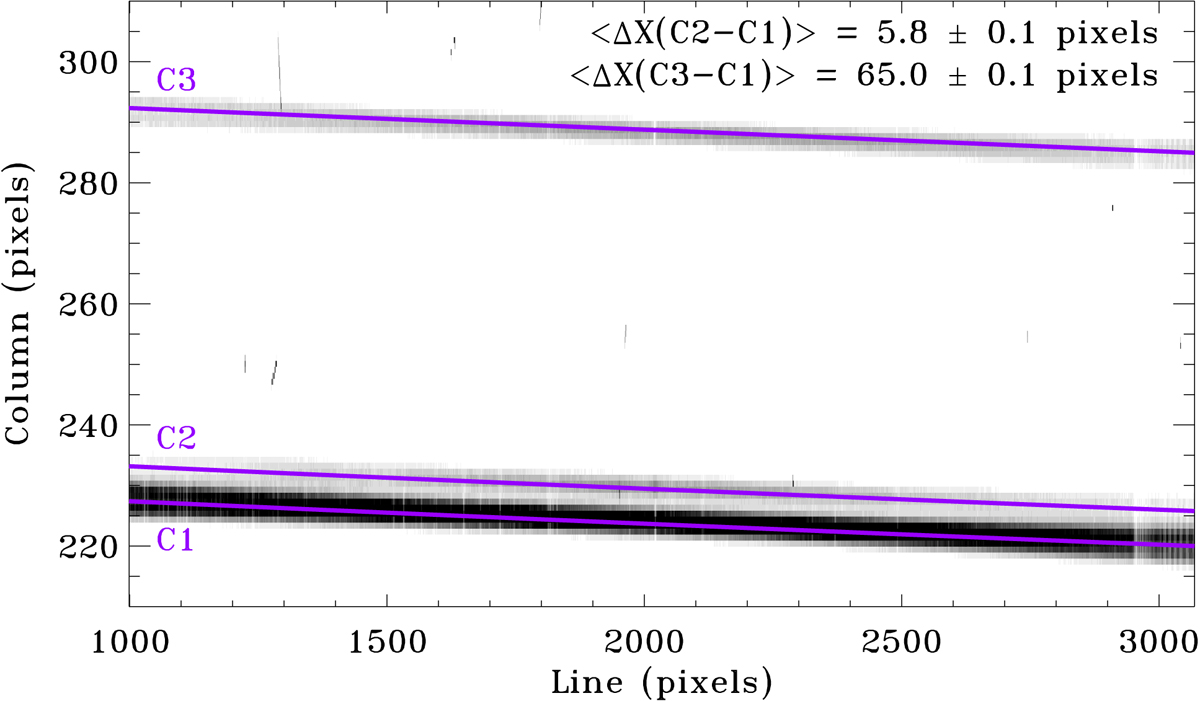
Fig. A.4.

Zoom on the section of the image where the traces of the three sources can be used for a spectral analysis. This corresponds to all the clear and unvignetted lines (Fig. A.3) and columns from 205 to 305. We also overplotted the trace (solid lines) obtained for each of the three sources. On the right upper corner, we indicate the mean separation between the main aperture (C1) and the two others (C2 and C3).
Current usage metrics show cumulative count of Article Views (full-text article views including HTML views, PDF and ePub downloads, according to the available data) and Abstracts Views on Vision4Press platform.
Data correspond to usage on the plateform after 2015. The current usage metrics is available 48-96 hours after online publication and is updated daily on week days.
Initial download of the metrics may take a while.


