Fig. 12.
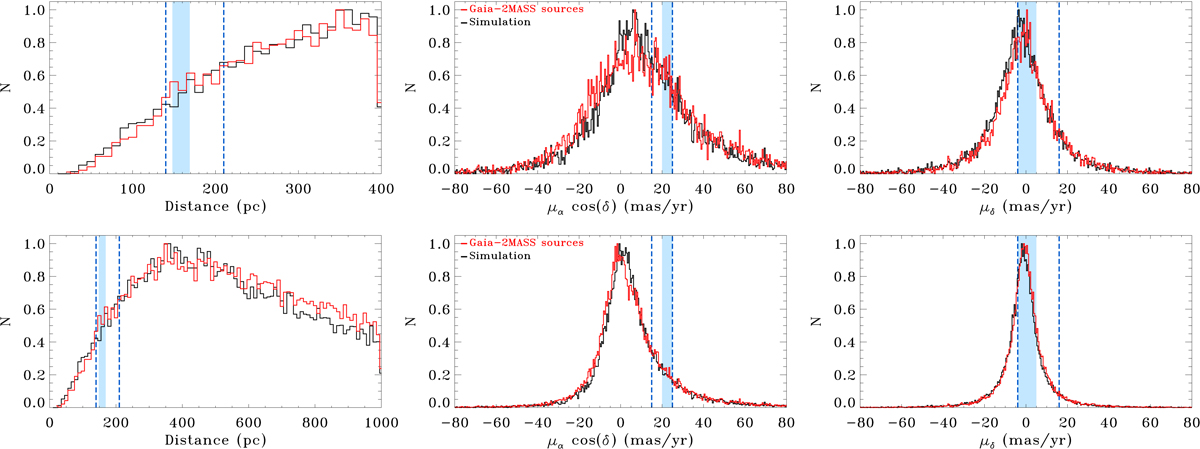
Comparison of the distribution of distance (left panels), and proper motion in right ascension (middle panels) and in declination (right panels) between the Gaia-2MASS sources and the simulation with the Besançon model (Sect. 4.3). We normalized the number of stars in each bin, dividing by the maximum number of sources obtained for each histogram. For these plots, we only considered all the sources having a distance lower than 400 pc (upper panels) and 1000 pc (lower panels). In each panel, the blue-shaded area denotes the region populated by the likely members of Cep II, while the dashed lines correspond to those belonging to Cep III.
Current usage metrics show cumulative count of Article Views (full-text article views including HTML views, PDF and ePub downloads, according to the available data) and Abstracts Views on Vision4Press platform.
Data correspond to usage on the plateform after 2015. The current usage metrics is available 48-96 hours after online publication and is updated daily on week days.
Initial download of the metrics may take a while.