Fig. 9
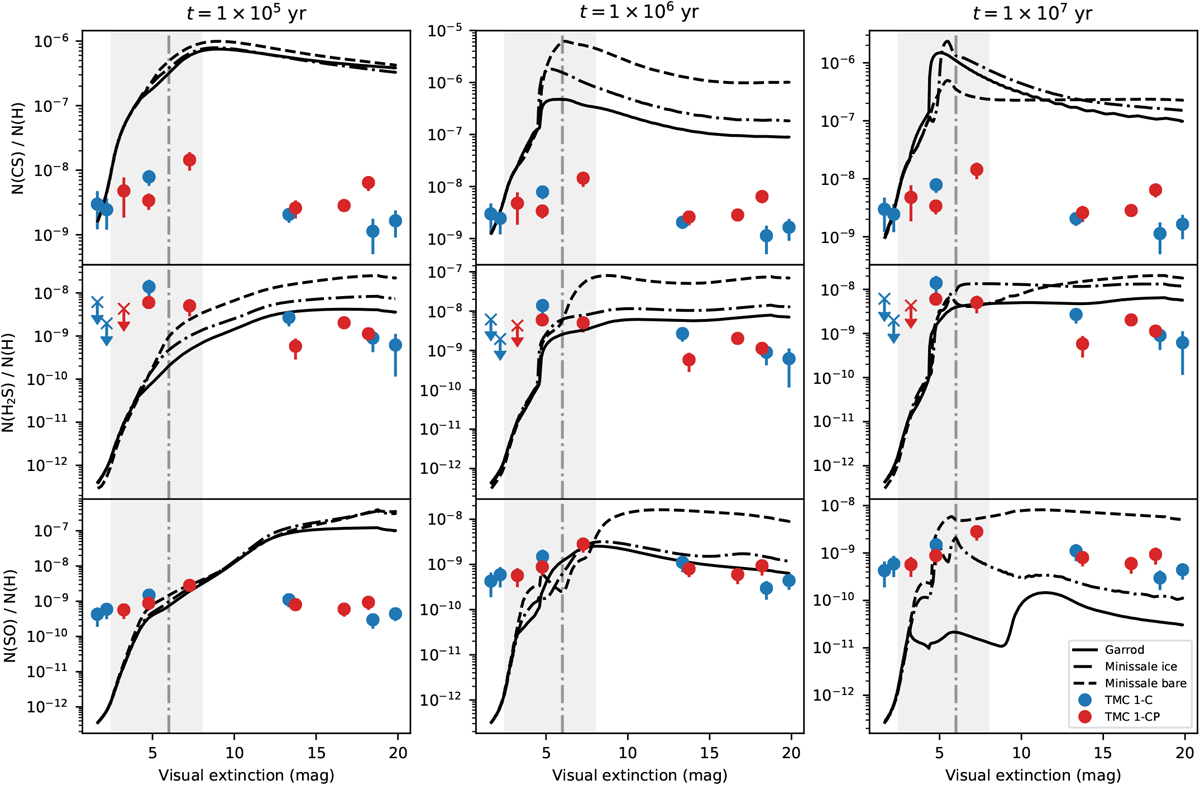
Predicted abundances (solid lines) of the CS (top row), H2S (middle row), and SO (bottom row) by models with different chemical desorption schemes, together with the observed abundances in TMC 1, at times 0.1−1−10 Myrs. Noticethat there is an extinction interval in which the observed H2S fit to different chemical desorption schemes. This can be interpreted as a change in the grain surface composition. The vertical dashed line corresponds to Av = 6 mag. The interval 2.5−8 mag around this value is shaded in all subplots.
Current usage metrics show cumulative count of Article Views (full-text article views including HTML views, PDF and ePub downloads, according to the available data) and Abstracts Views on Vision4Press platform.
Data correspond to usage on the plateform after 2015. The current usage metrics is available 48-96 hours after online publication and is updated daily on week days.
Initial download of the metrics may take a while.