Fig. 2
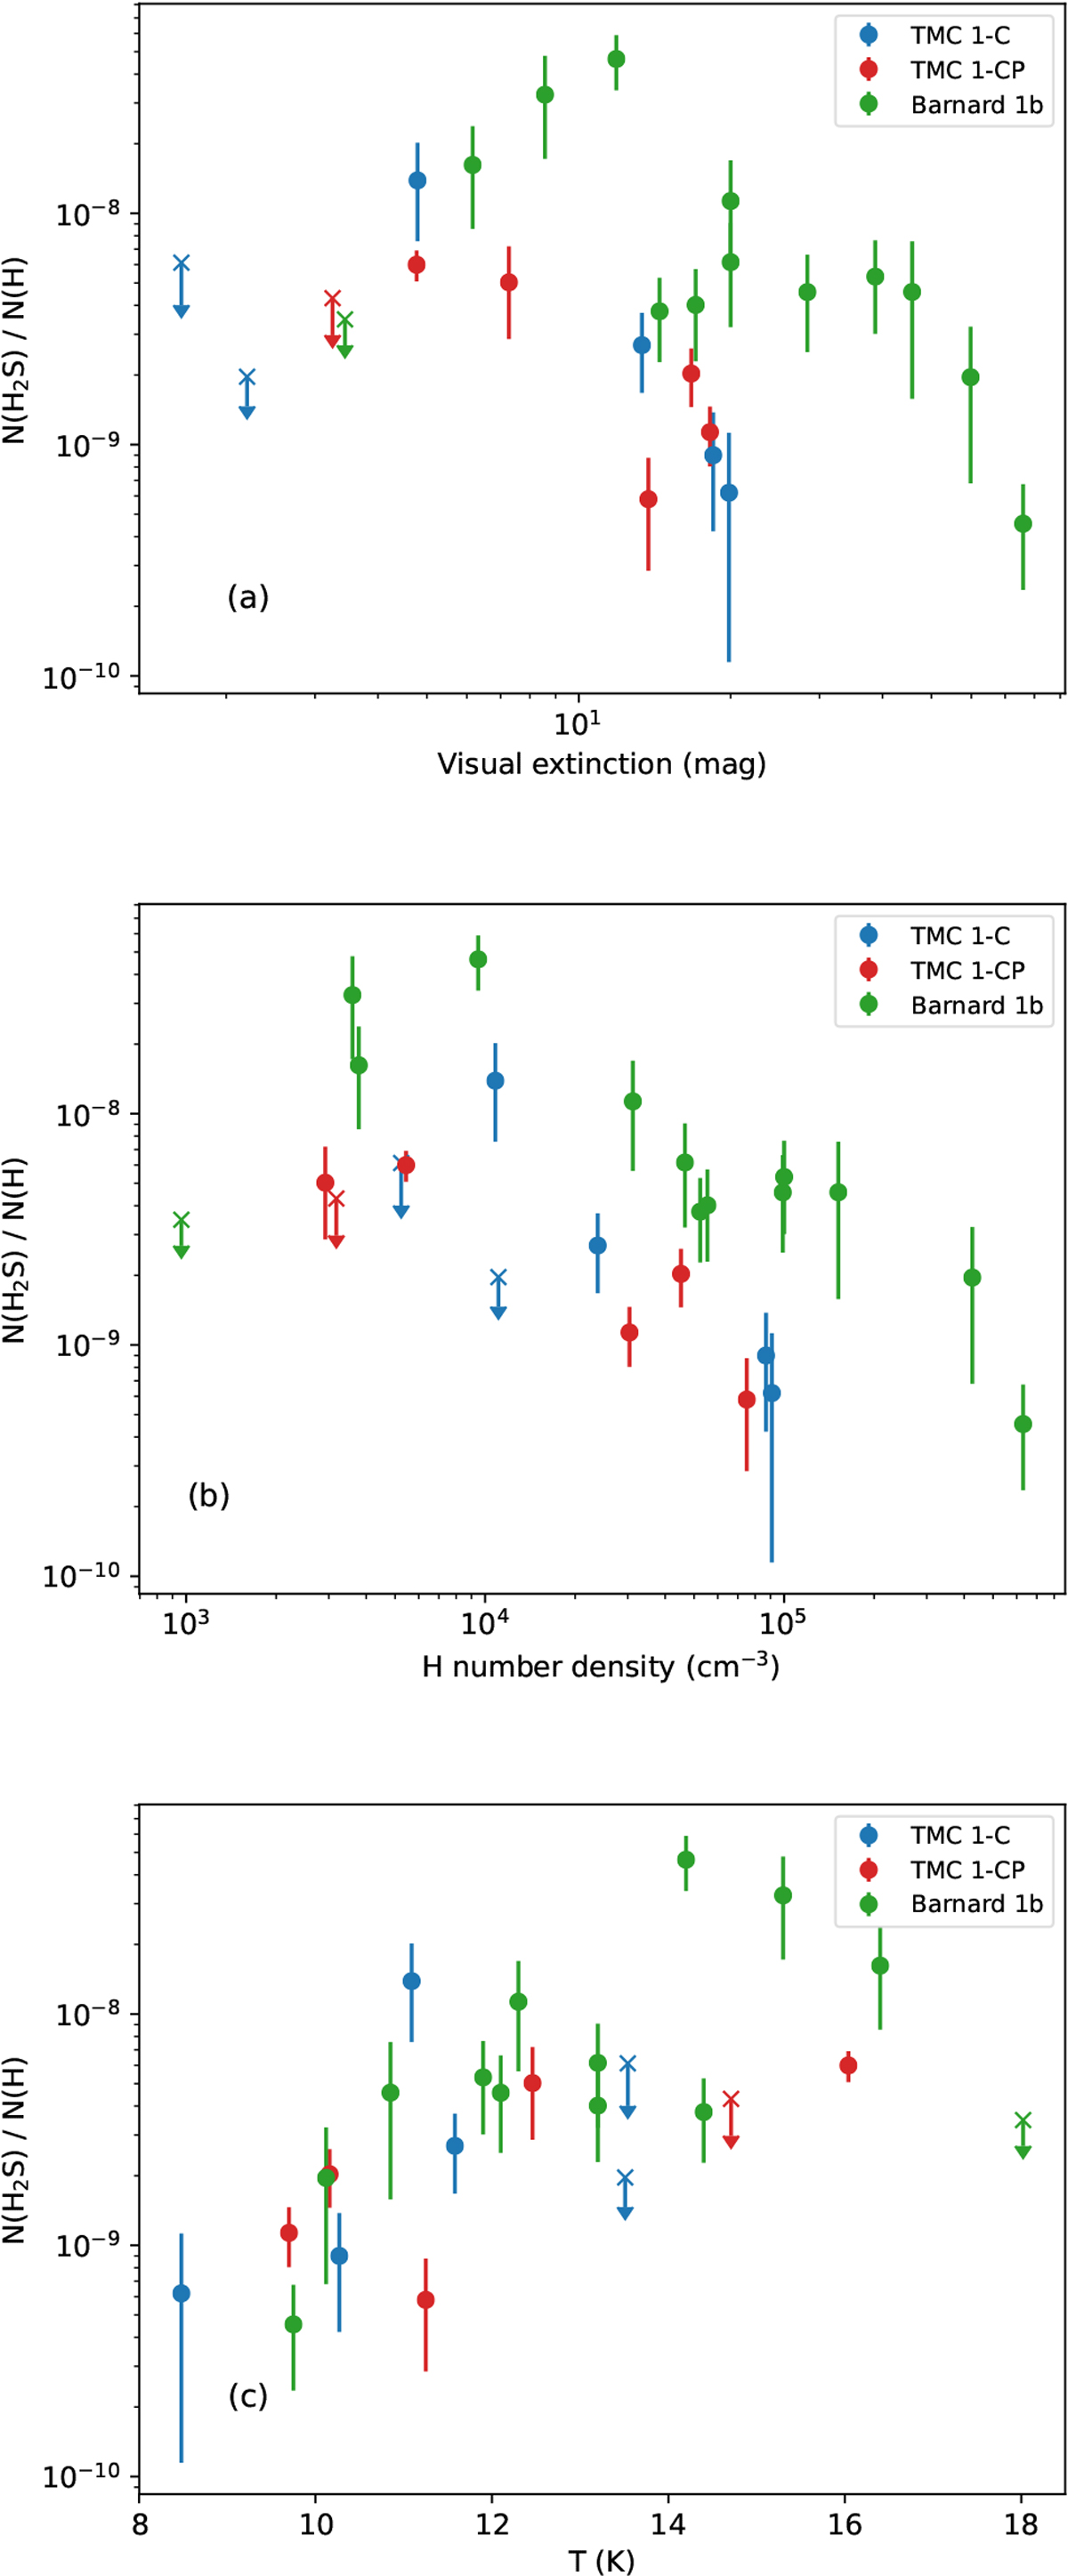
Panel a: observed H2S abundance as a function of visual extinction in TMC 1-C (blue), TMC 1-CP (red), and Barnard 1b (green). In a similar fashion, panel b: observed H2S gas-phase abundance against the H number density in TMC 1 and Barnard 1b cores. Crosses represent upper bound values. Finally, panel c: the H2S abundance against the gas kinetic temperature.
Current usage metrics show cumulative count of Article Views (full-text article views including HTML views, PDF and ePub downloads, according to the available data) and Abstracts Views on Vision4Press platform.
Data correspond to usage on the plateform after 2015. The current usage metrics is available 48-96 hours after online publication and is updated daily on week days.
Initial download of the metrics may take a while.