Fig. 12
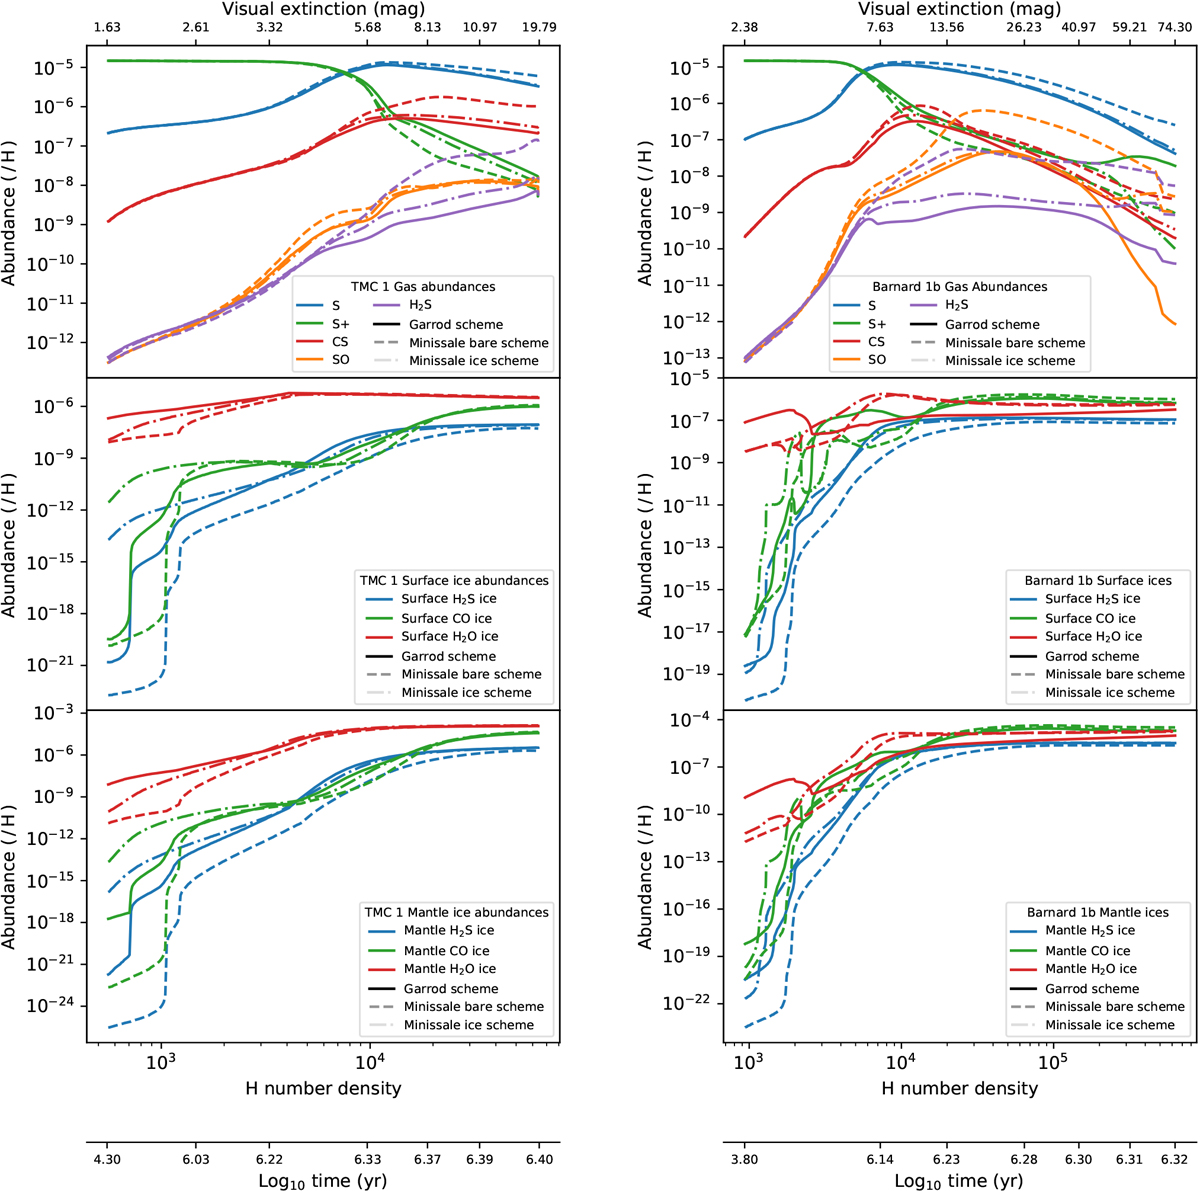
Predicted abundances of different molecules in gas phase (top row), ice surfaces (middle row), and ice mantles (bottom row) of TMC 1 (left column), and Barnard 1b (right column), according to the different desorption schemes. They are plotted as a function of the number density, together with the visual extinction that corresponds to such densities (see Figs. 4a and b, 5a and b), and the time according to a freefall collapse.
Current usage metrics show cumulative count of Article Views (full-text article views including HTML views, PDF and ePub downloads, according to the available data) and Abstracts Views on Vision4Press platform.
Data correspond to usage on the plateform after 2015. The current usage metrics is available 48-96 hours after online publication and is updated daily on week days.
Initial download of the metrics may take a while.