Fig. 1
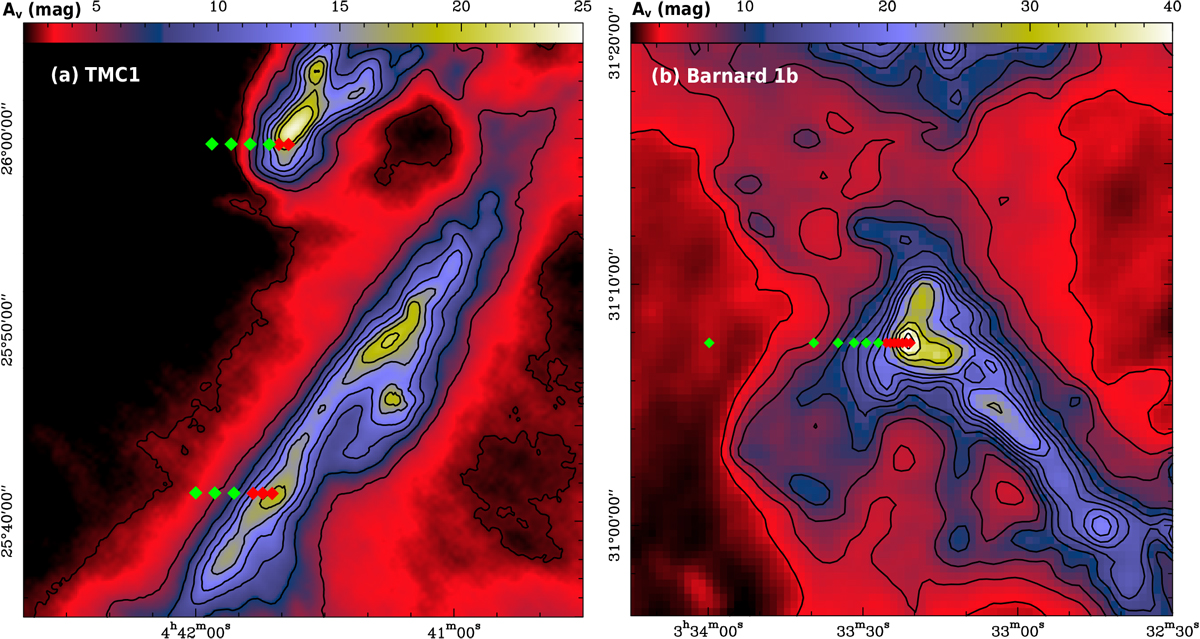
Left panel: TMC 1 total visual extinction (the visual extinction along the line of sight) map based on Herschel dust emission maps from Jason Kirk (private communication). Right panel: visual extinction map of Barnard 1 from the opacity at 850 μm derived by Zari et al. (2016). In both maps the observed positions are in lines of constant declination, or cuts, where the red squares mark those positions in which only IRAM 30 m telescope data is obtained, and green squares mark positions with additional Yebes 40 m data.
Current usage metrics show cumulative count of Article Views (full-text article views including HTML views, PDF and ePub downloads, according to the available data) and Abstracts Views on Vision4Press platform.
Data correspond to usage on the plateform after 2015. The current usage metrics is available 48-96 hours after online publication and is updated daily on week days.
Initial download of the metrics may take a while.