Fig. A.1
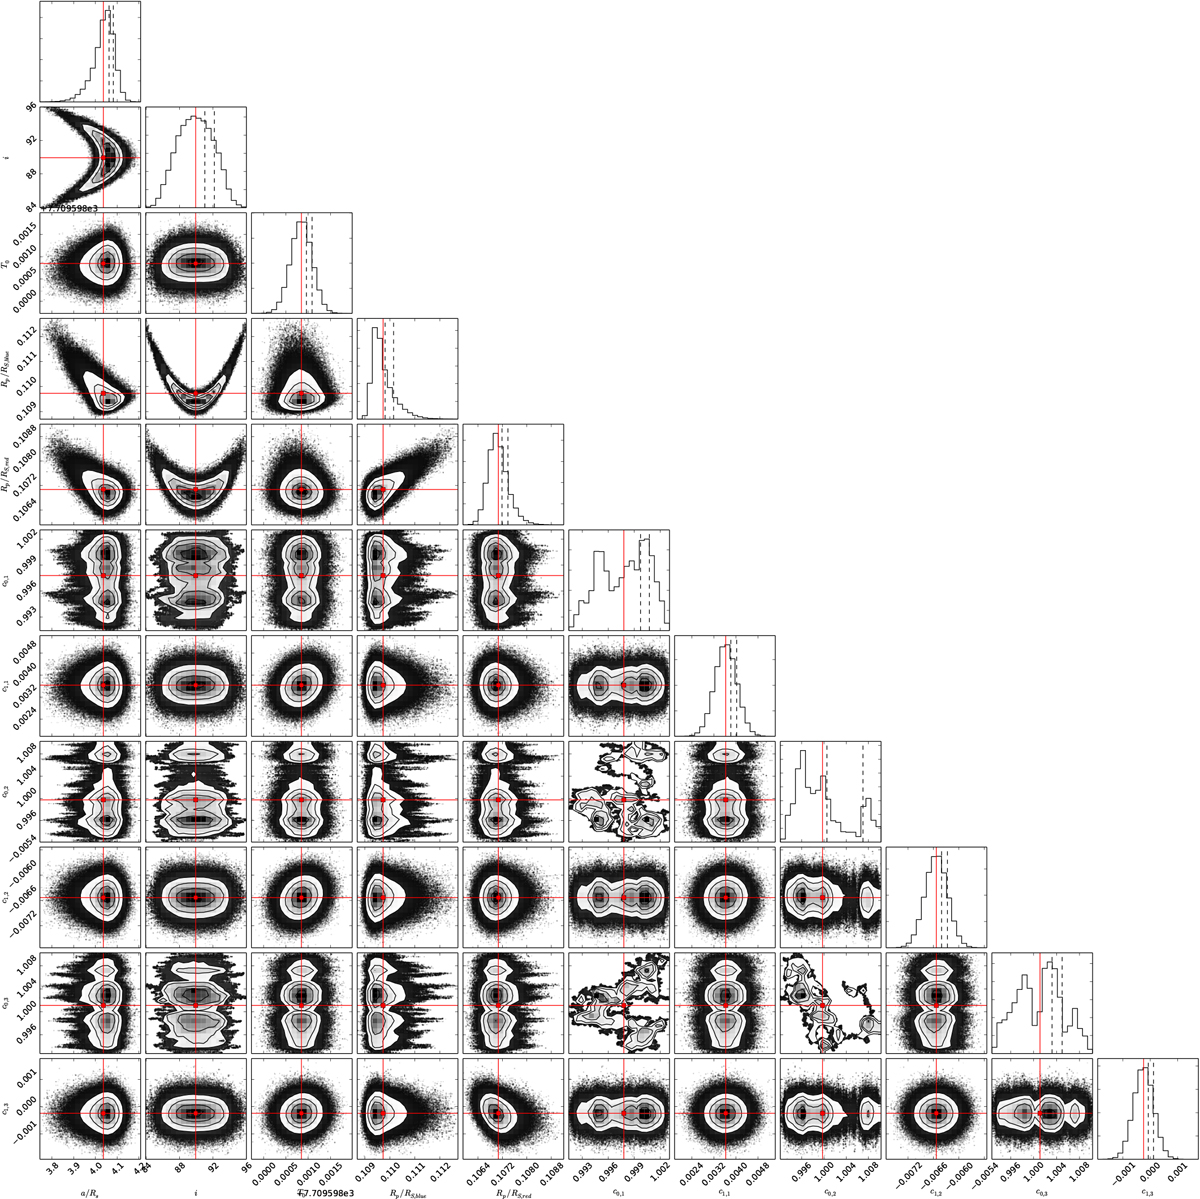
Posterior distributions and correlations between the transit parameters, a/RS, i, T0 and RP /RS and the coefficients for the linear slope, c0 and c1, for the white light curves. Subindex 1, 2 and 3 correspond to each one of the three transits, following the order of Fig. 3. Red points correspond to the best-fit parameters and shaded gray to white areas correspond to 1, 2, and 3-σ uncertainty regions.
Current usage metrics show cumulative count of Article Views (full-text article views including HTML views, PDF and ePub downloads, according to the available data) and Abstracts Views on Vision4Press platform.
Data correspond to usage on the plateform after 2015. The current usage metrics is available 48-96 hours after online publication and is updated daily on week days.
Initial download of the metrics may take a while.