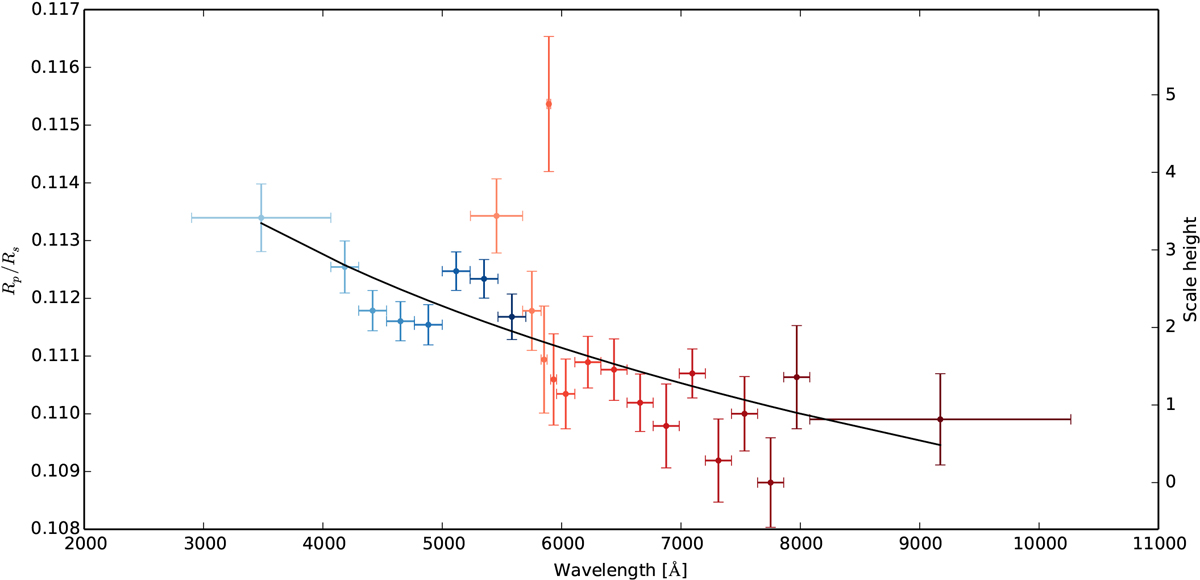
Fig. 7

Broad-band transmission spectrum for WASP-76 b. Blue dots correspond to the G430L grating, while red dots correspond to the G750L grating. The colors match those in Figs. 4–6. The black line shows the fitted Rayleigh slope from Eq. (8). The left vertical axis shows the planet-to-star radii ratio, while the right vertical axis shows the same variability in scale heights.
Current usage metrics show cumulative count of Article Views (full-text article views including HTML views, PDF and ePub downloads, according to the available data) and Abstracts Views on Vision4Press platform.
Data correspond to usage on the plateform after 2015. The current usage metrics is available 48-96 hours after online publication and is updated daily on week days.
Initial download of the metrics may take a while.


