Fig. 4
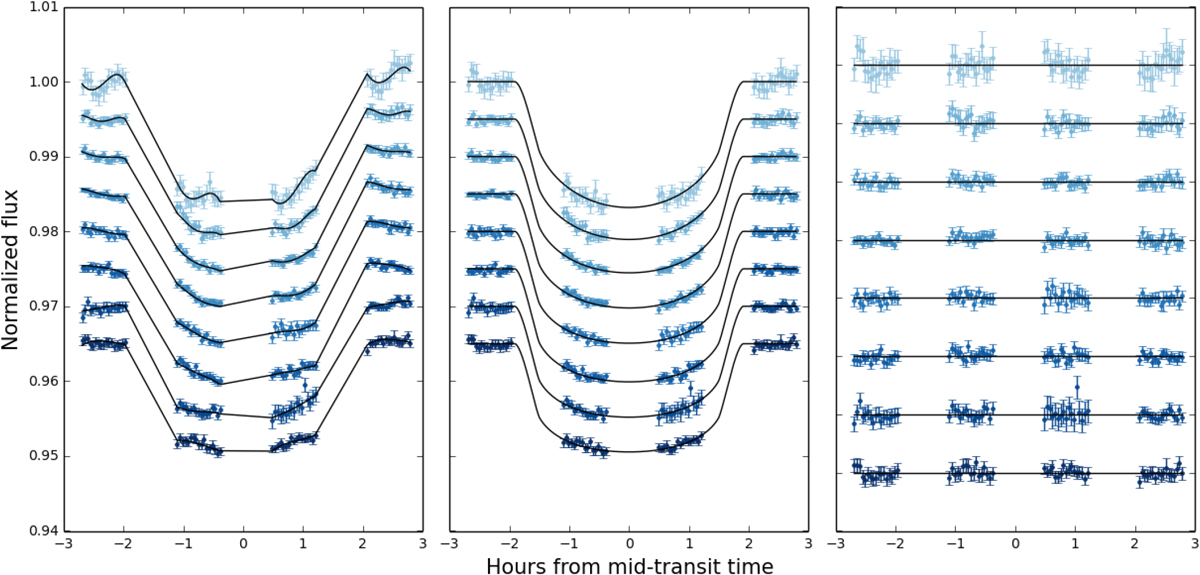
Spectral bin transit light curves obtained with the G430L grating on HST/STIS. The light curves have an arbitrary offset in relative flux and are ordered by wavelength (see Table 4). Here, the bin at shortest wavelengths is located at the top (lightest in color in the figure) and the bin at the longest wavelengths is located at the bottom (darkest in color in the figure). The individual photometric errors are scaled with the standard deviation of the residuals and further increased by β, as describedin Sect. 3.4. Left: light curves overplotted with the best-fit combined model. Middle: light curves corrected for systematic effects, with the best-fit transit model overplotted. Right: residuals.
Current usage metrics show cumulative count of Article Views (full-text article views including HTML views, PDF and ePub downloads, according to the available data) and Abstracts Views on Vision4Press platform.
Data correspond to usage on the plateform after 2015. The current usage metrics is available 48-96 hours after online publication and is updated daily on week days.
Initial download of the metrics may take a while.