Fig. 3
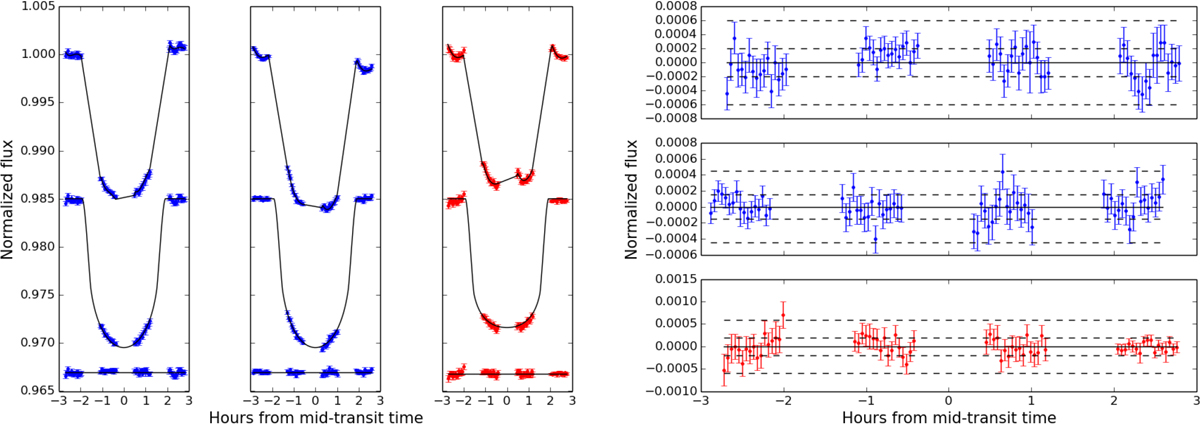
HST white light curves for the three transits, shifted to their individual mid-transit times and shown in hours. Blue transits correspond to those taken with the G430L grating, and red to the one collected with the G750L grating. Left: from top to bottom we show the transit light curves with the systematic effects, along with our best-fit combined model (transit times detrending), the detrended data along with our best-fit transit model, and the residual light curves after both components were subtracted. Right: zoom in to the residuals. Dashed horizontal lines indicate ±1 and ±3 times the standard deviation of the residuals to guide the eyes.
Current usage metrics show cumulative count of Article Views (full-text article views including HTML views, PDF and ePub downloads, according to the available data) and Abstracts Views on Vision4Press platform.
Data correspond to usage on the plateform after 2015. The current usage metrics is available 48-96 hours after online publication and is updated daily on week days.
Initial download of the metrics may take a while.