Fig. 9
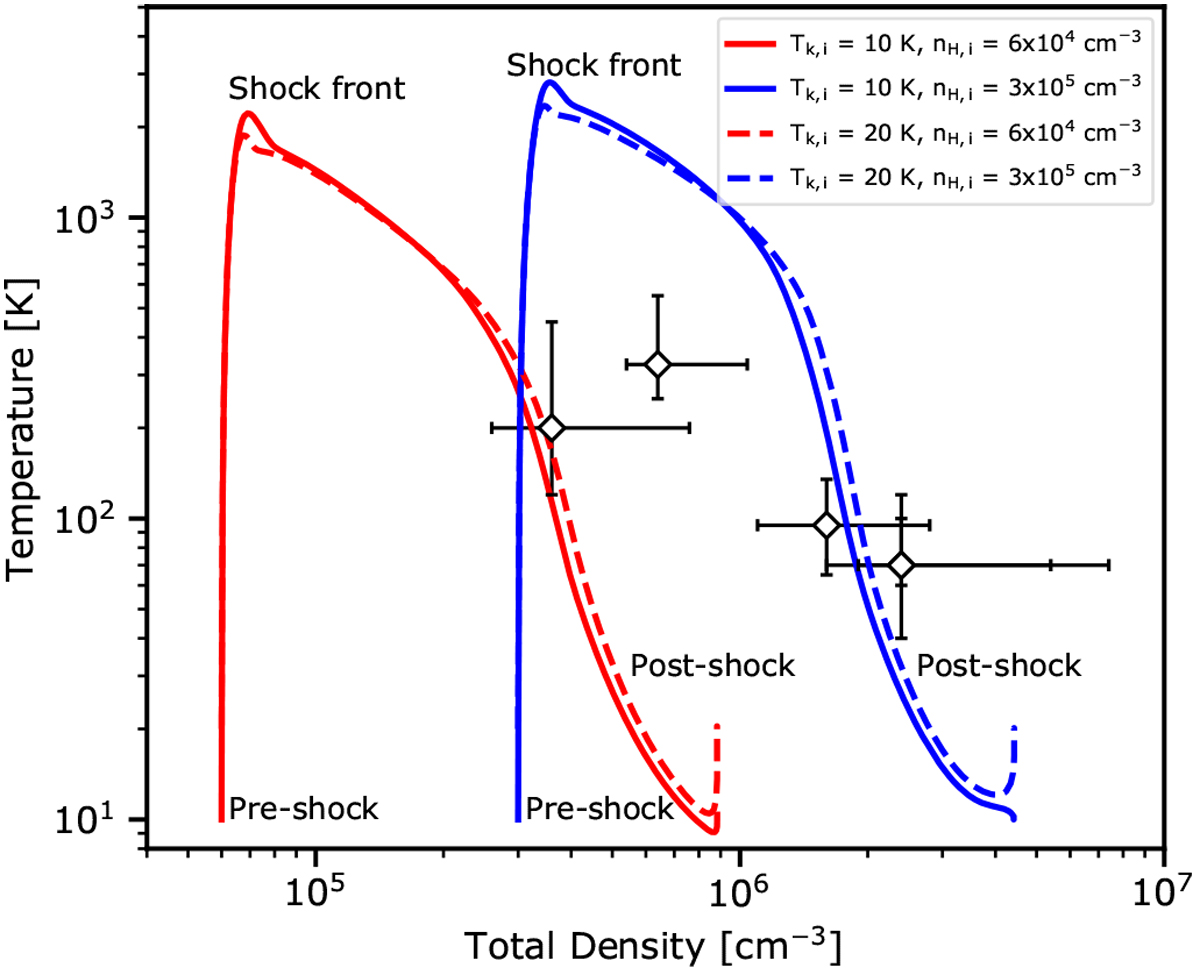
Comparison between the density and temperature evolutions as predicted by the Paris-Durham shock model (coloured curves) for initial pre-shock densities of 6 × 10⁴ and 3 ×105 cm−3 and initial temperatures of 10 and 20 K with the densities and temperatures estimated with the RADEX analysis of the SO2 emission towards various SiO peaks (diamonds; see Table 3).
Current usage metrics show cumulative count of Article Views (full-text article views including HTML views, PDF and ePub downloads, according to the available data) and Abstracts Views on Vision4Press platform.
Data correspond to usage on the plateform after 2015. The current usage metrics is available 48-96 hours after online publication and is updated daily on week days.
Initial download of the metrics may take a while.