Fig. 4
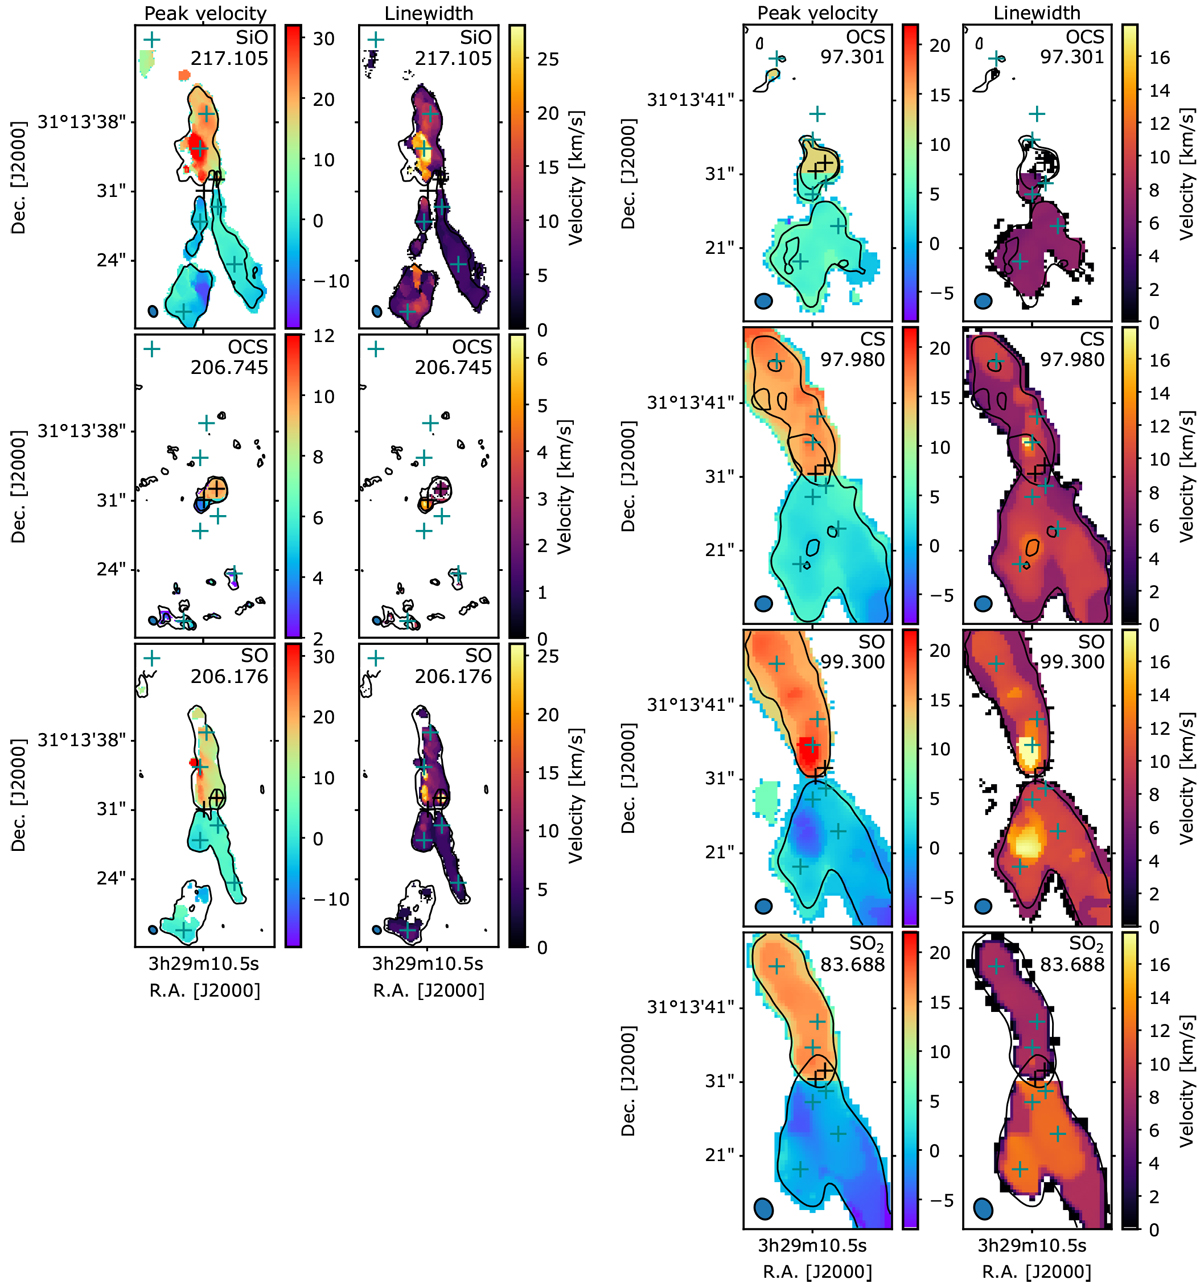
Moment 1 and moment 2 maps of the SiO(5−4), OCS(17−16), and SO(65−54) emission observed at “high”, 1′′, angular resolution (left panels) and of the OCS(8−7), SO(32 −21), CS(2− 1), and SO2(81,7−80,8) emission at “low”, 2−4′′, resolution (right panels). Contours represent the 3σ level. Black crosses represent the position of the 4A1 and 4A2 sources of the IRAS4A binary system. Green crosses represent the position of the SiO(5–4) emission peaks along the outflows.
Current usage metrics show cumulative count of Article Views (full-text article views including HTML views, PDF and ePub downloads, according to the available data) and Abstracts Views on Vision4Press platform.
Data correspond to usage on the plateform after 2015. The current usage metrics is available 48-96 hours after online publication and is updated daily on week days.
Initial download of the metrics may take a while.