Fig. 3
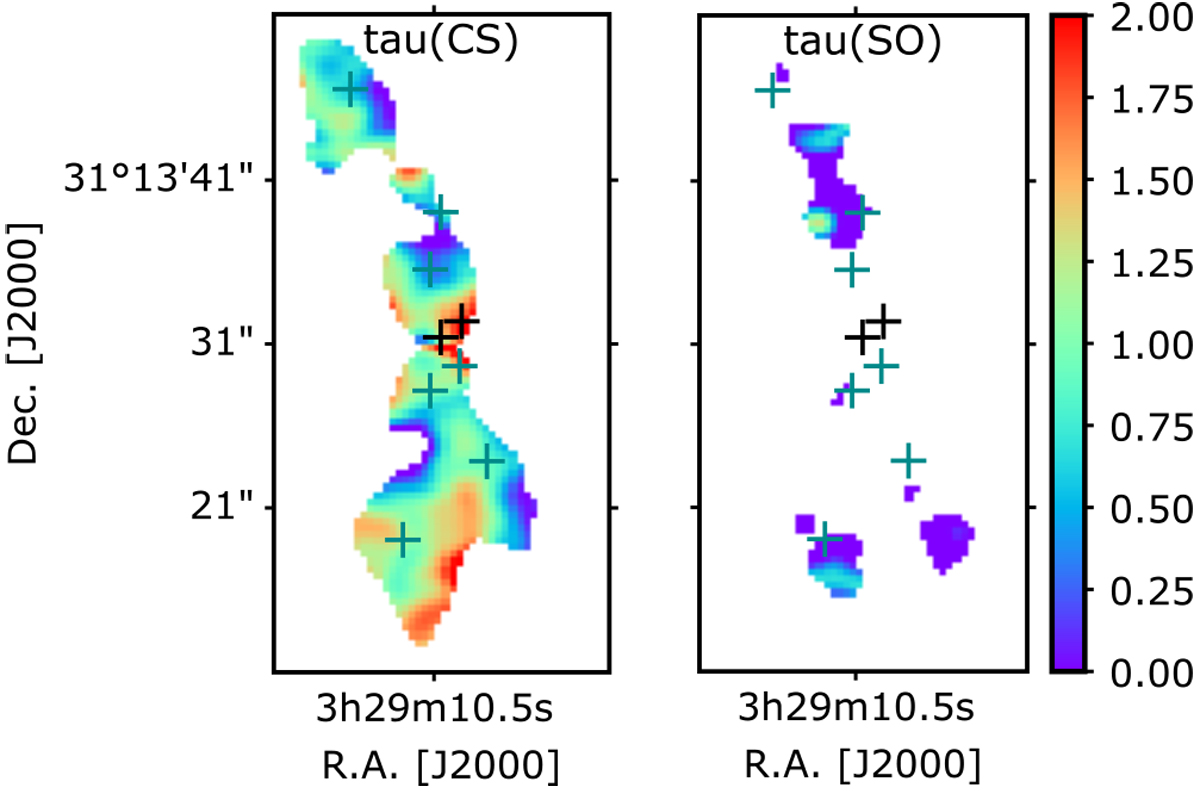
Opacity maps of the CS(2−1) and SO(32−21) transitions estimated from the intensity ratio of the 32S and 34 S transitions when the flux of both isotopologues is higher than four times the σ rms noise level and assuming the 34S transitions are optically thin (see text for more details). Black crosses represent the position of the 4A1 and 4A2 sources of the IRAS4A binary system. Green crosses represent the position of the SiO(5–4) emission peaks along the outflows.
Current usage metrics show cumulative count of Article Views (full-text article views including HTML views, PDF and ePub downloads, according to the available data) and Abstracts Views on Vision4Press platform.
Data correspond to usage on the plateform after 2015. The current usage metrics is available 48-96 hours after online publication and is updated daily on week days.
Initial download of the metrics may take a while.