Open Access
Fig. 4
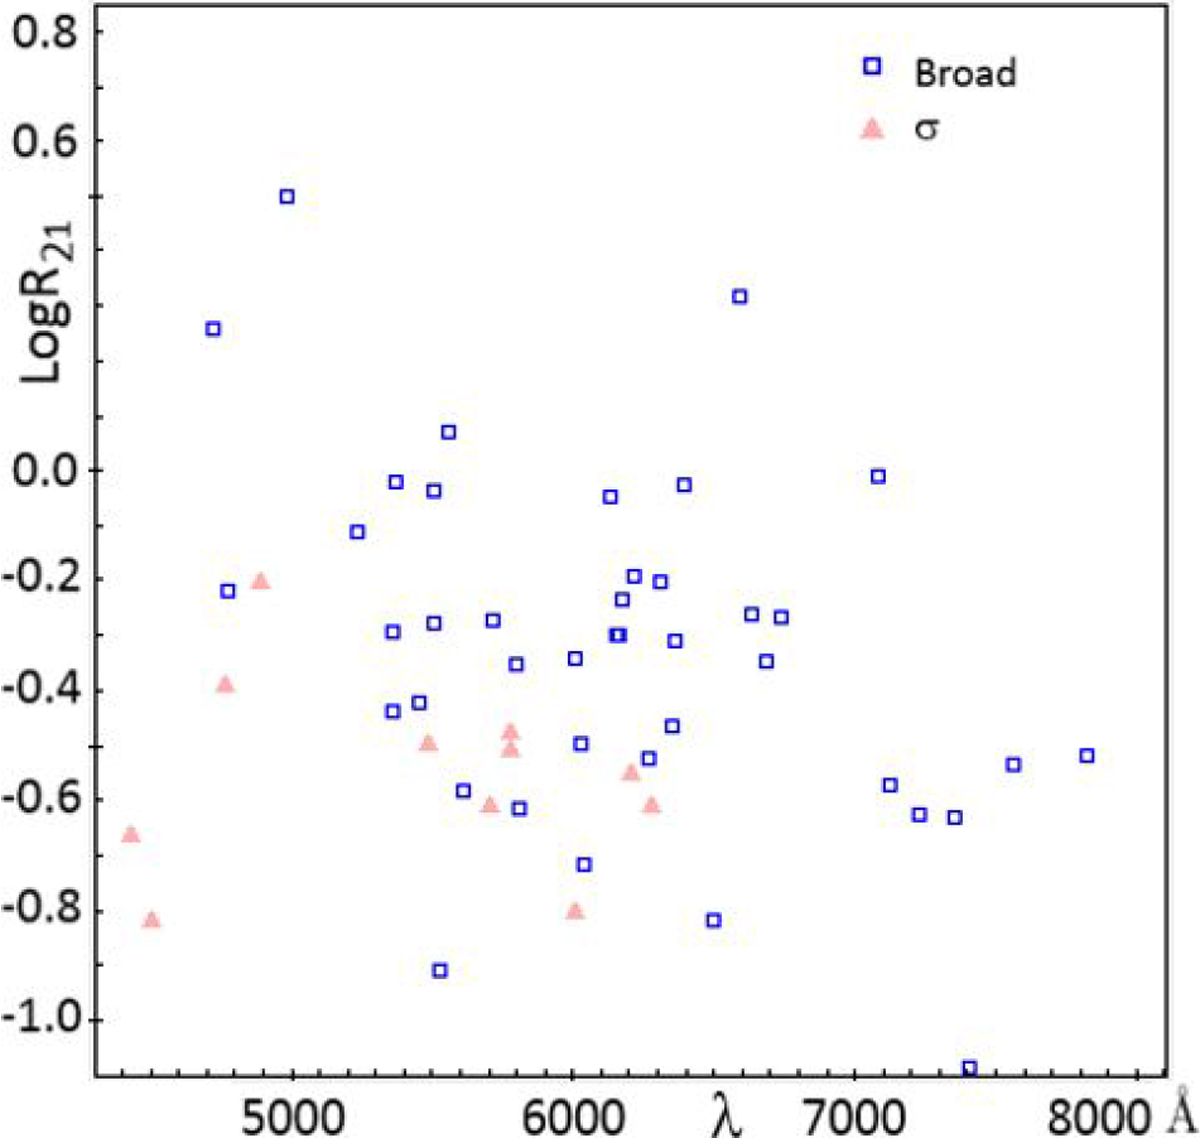
Same as Fig. 3 for broad DIBs (FWHM > 1.1 Å, Table 2). These DIBs are shown by blue open squares, except for the DIBs identified in Table 1 as σ (Lan et al. 2015) which appear as orange full triangles.
Current usage metrics show cumulative count of Article Views (full-text article views including HTML views, PDF and ePub downloads, according to the available data) and Abstracts Views on Vision4Press platform.
Data correspond to usage on the plateform after 2015. The current usage metrics is available 48-96 hours after online publication and is updated daily on week days.
Initial download of the metrics may take a while.