Fig. 9.
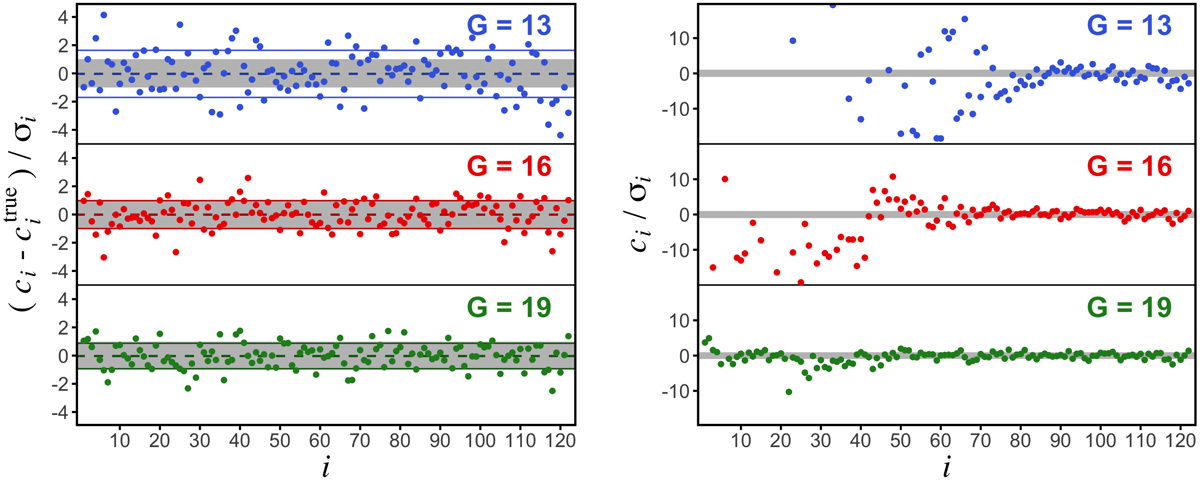
Example for the calibration results for one test SPD, and for three different G band magnitudes, 13m, 16m, and 19m. Left: difference between the coefficients in the combined basis and true coefficients, normalised to the standard error. The grey shaded regions show the ±1σi intervals, the dashed lines the sample mean, and the solid lines the sample standard deviation. Right: coefficients divided by the standard error. The grey shaded regions show the ±1σi intervals.
Current usage metrics show cumulative count of Article Views (full-text article views including HTML views, PDF and ePub downloads, according to the available data) and Abstracts Views on Vision4Press platform.
Data correspond to usage on the plateform after 2015. The current usage metrics is available 48-96 hours after online publication and is updated daily on week days.
Initial download of the metrics may take a while.