Fig. 7.
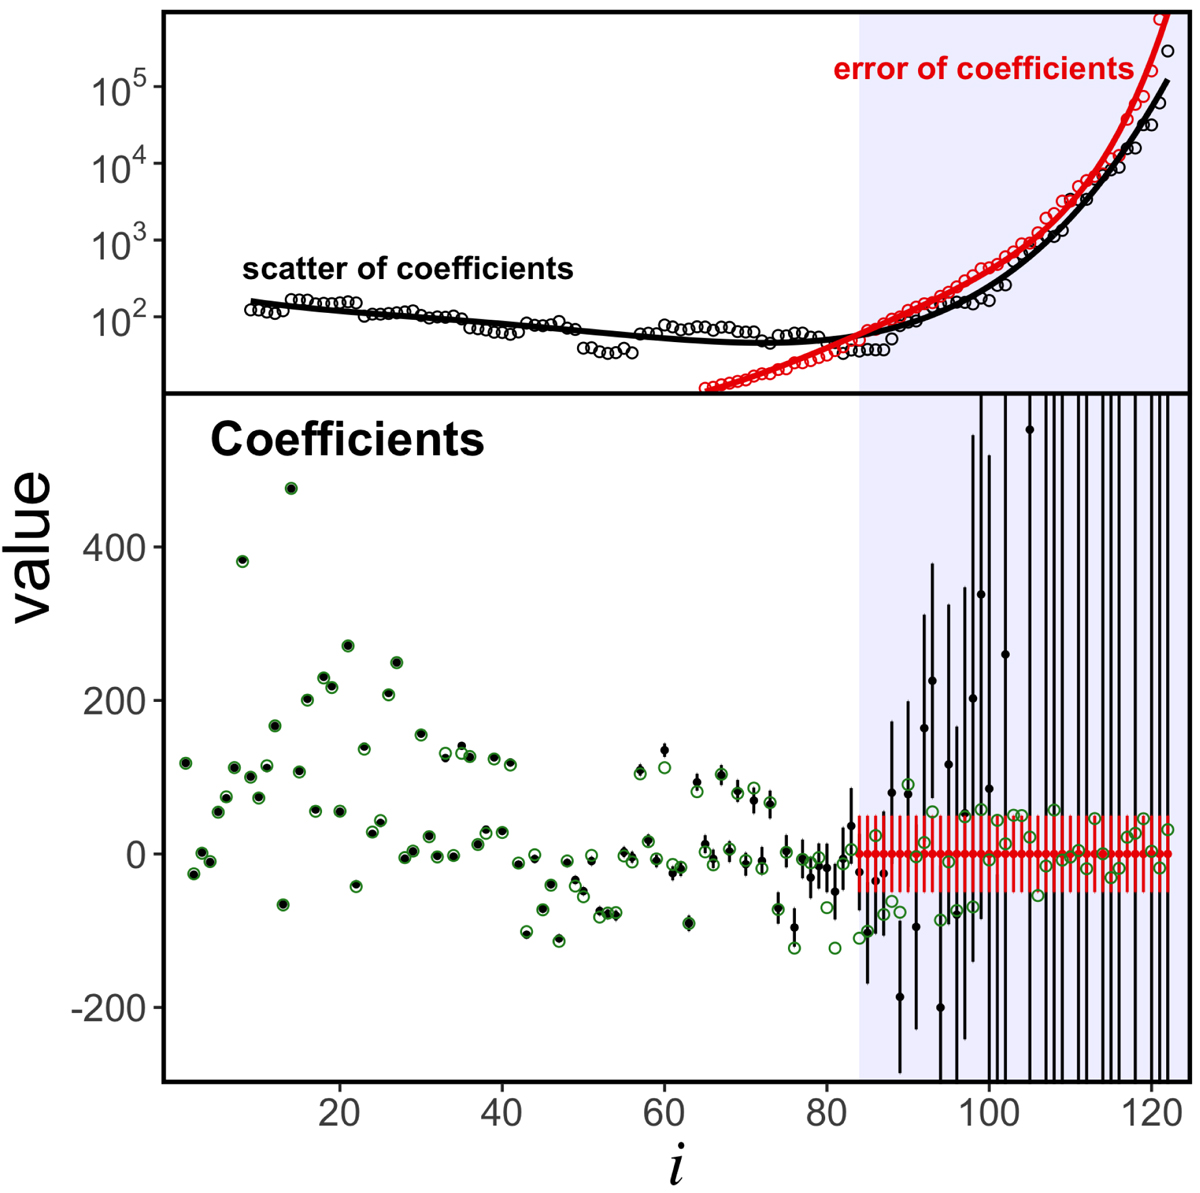
Example for the correction of poorly constrained coefficients for one star of the test set. Upper panel: scatter of the coefficients in a window of eight coefficients (black symbols) and errors of the coefficients (red symbols). The black and red lines give polynomial approximations to the scatter and errors, respectively. Lower panel: coefficients in the common XP basis, in the reference system diagonalising the covariance matrix. Black symbols: result of the calibration. Red symbols: corrected coefficients. Green symbols: true coefficients.
Current usage metrics show cumulative count of Article Views (full-text article views including HTML views, PDF and ePub downloads, according to the available data) and Abstracts Views on Vision4Press platform.
Data correspond to usage on the plateform after 2015. The current usage metrics is available 48-96 hours after online publication and is updated daily on week days.
Initial download of the metrics may take a while.