Fig. 6.
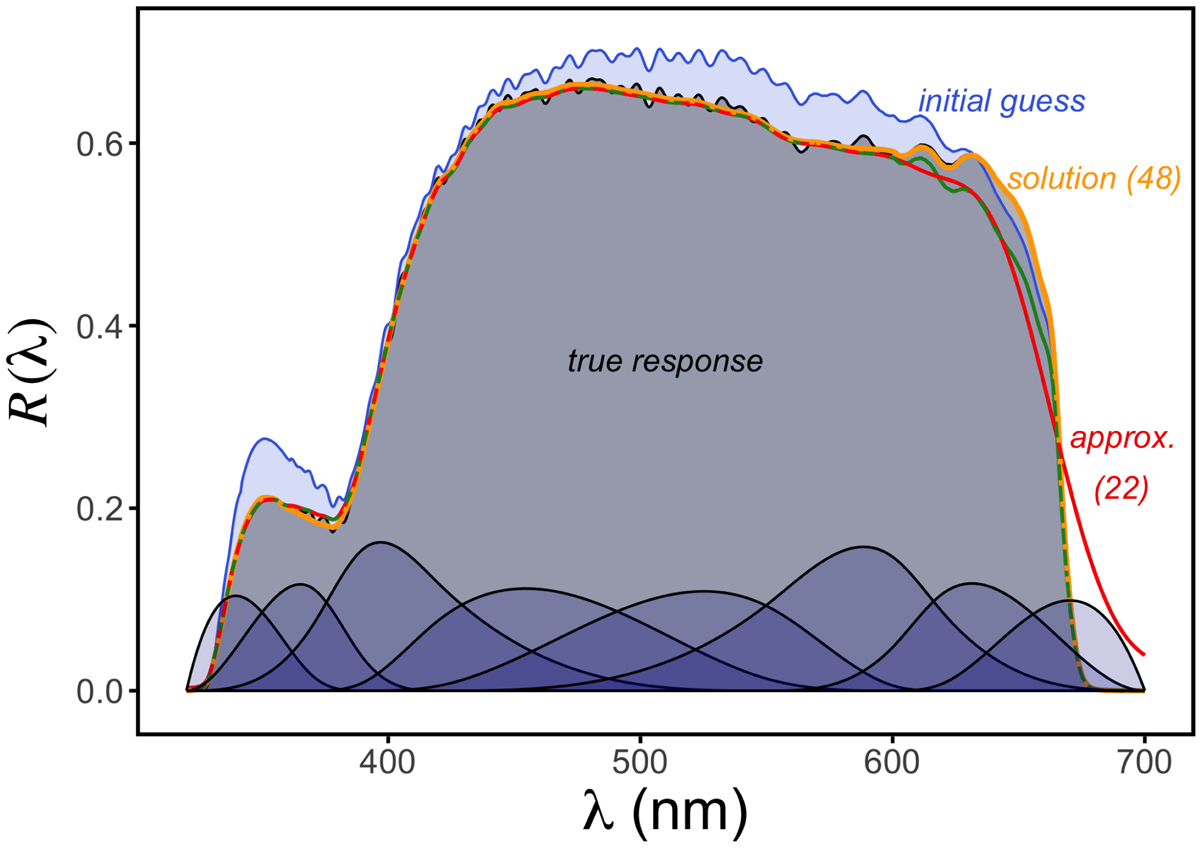
Illustration of the different steps of construction of the response function for BP. The blue line and shaded region is the initial guess, and the black line and grey shaded region is the true passband. The red line is the approximation using Eq. (22) and the green line the combination of the initial guess and the approximation with Eq. (22). The orange line shows the solution obtained with Eq. (48). The B-spline basis functions Bk(λ) are shown for comparison at the bottom of the plot.
Current usage metrics show cumulative count of Article Views (full-text article views including HTML views, PDF and ePub downloads, according to the available data) and Abstracts Views on Vision4Press platform.
Data correspond to usage on the plateform after 2015. The current usage metrics is available 48-96 hours after online publication and is updated daily on week days.
Initial download of the metrics may take a while.