Fig. 5.
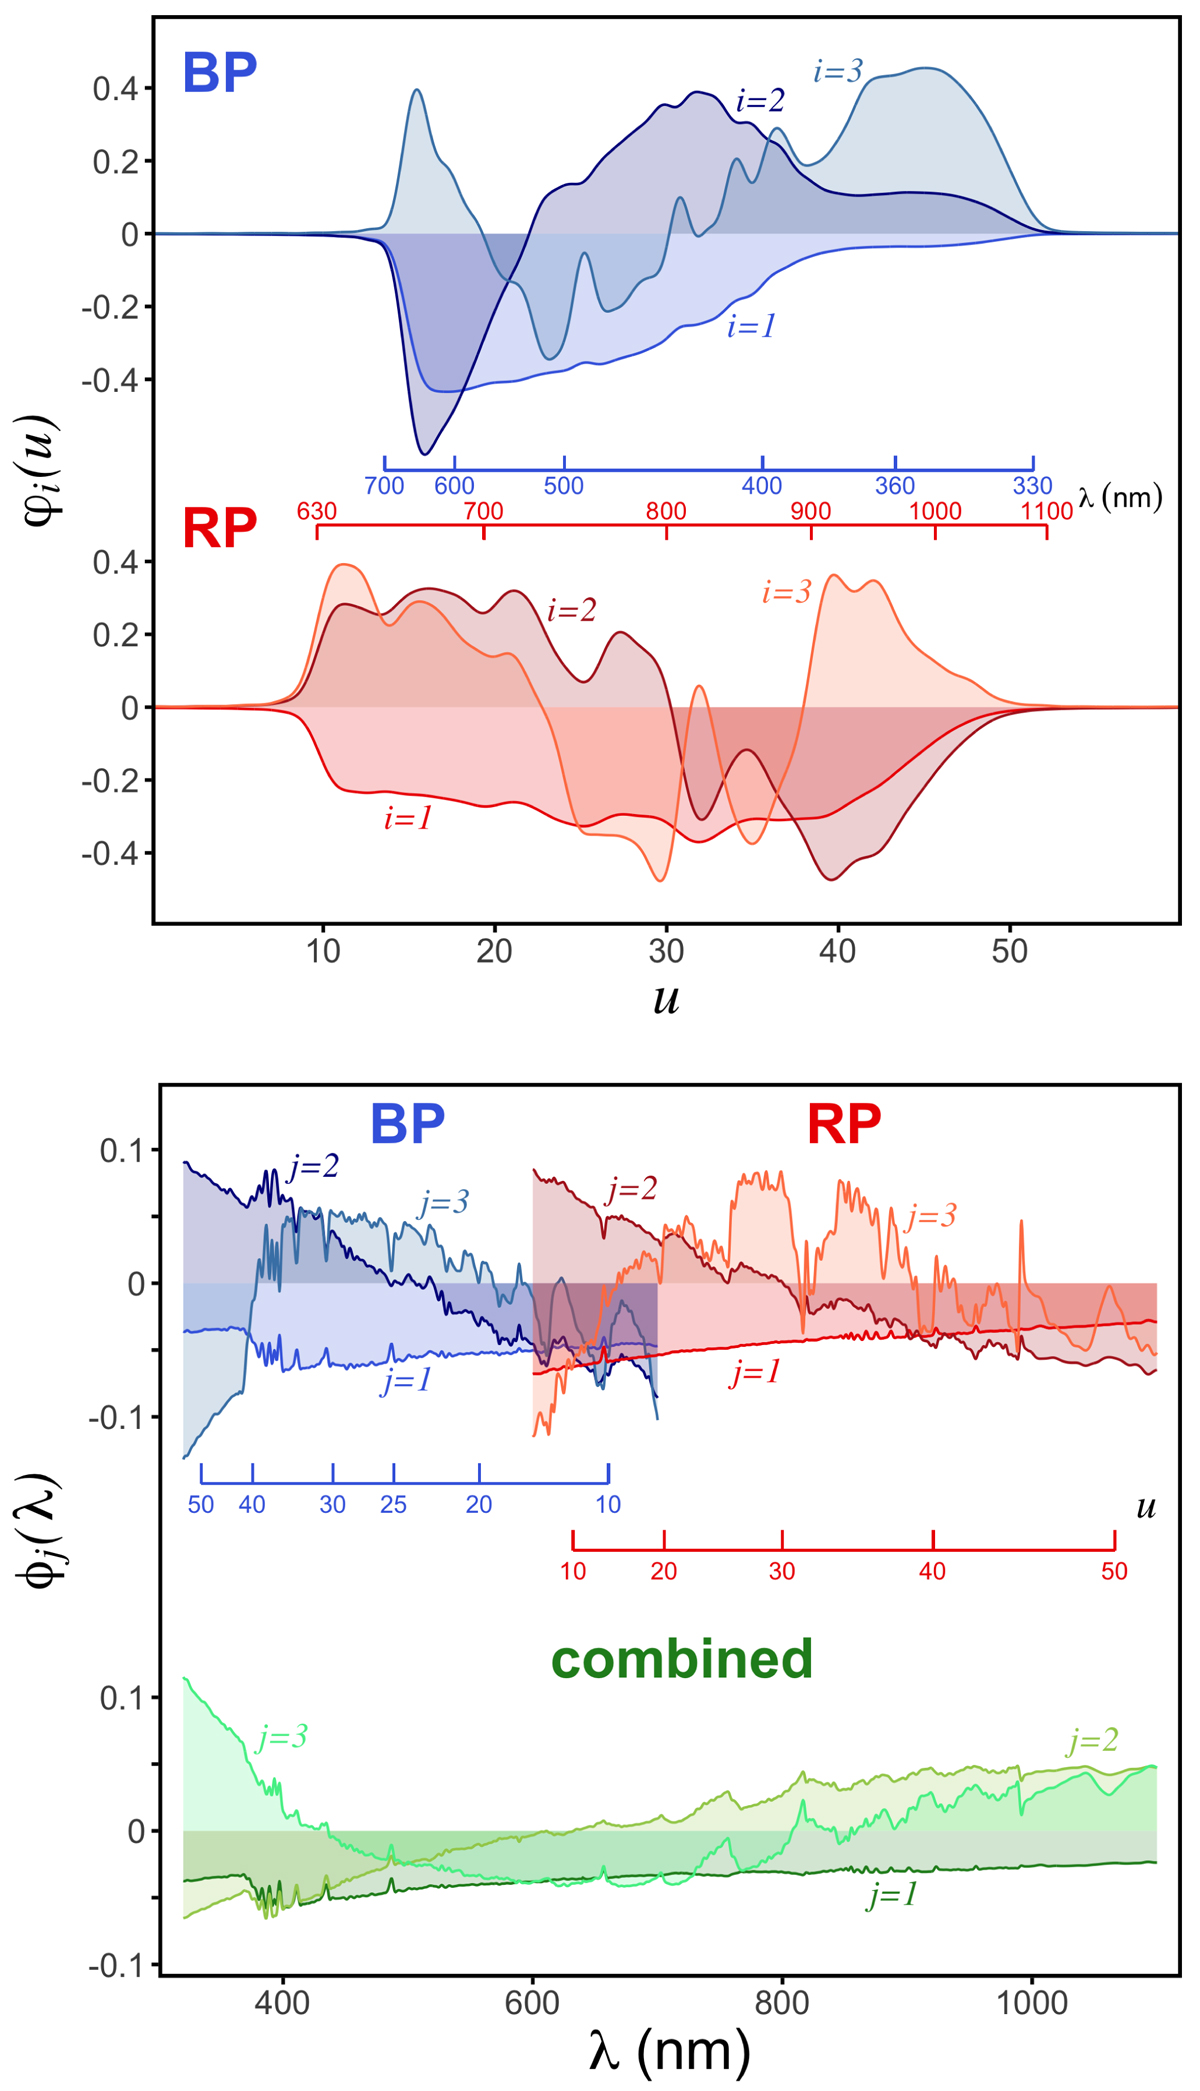
Examples for the basis functions for W and V. Upper panel: first three basis functions φi(u), i = 1, 2, 3 for the observational spectra for BP and RP. The corresponding wavelength axes are indicated. Lower panel: first three basis functions ϕj(λ), j = 1, 2, 3, for the SPDs for BP and RP, and the combined basis functions covering the entire wavelength range. The corresponding sample axes are indicated.
Current usage metrics show cumulative count of Article Views (full-text article views including HTML views, PDF and ePub downloads, according to the available data) and Abstracts Views on Vision4Press platform.
Data correspond to usage on the plateform after 2015. The current usage metrics is available 48-96 hours after online publication and is updated daily on week days.
Initial download of the metrics may take a while.