Fig. 4.
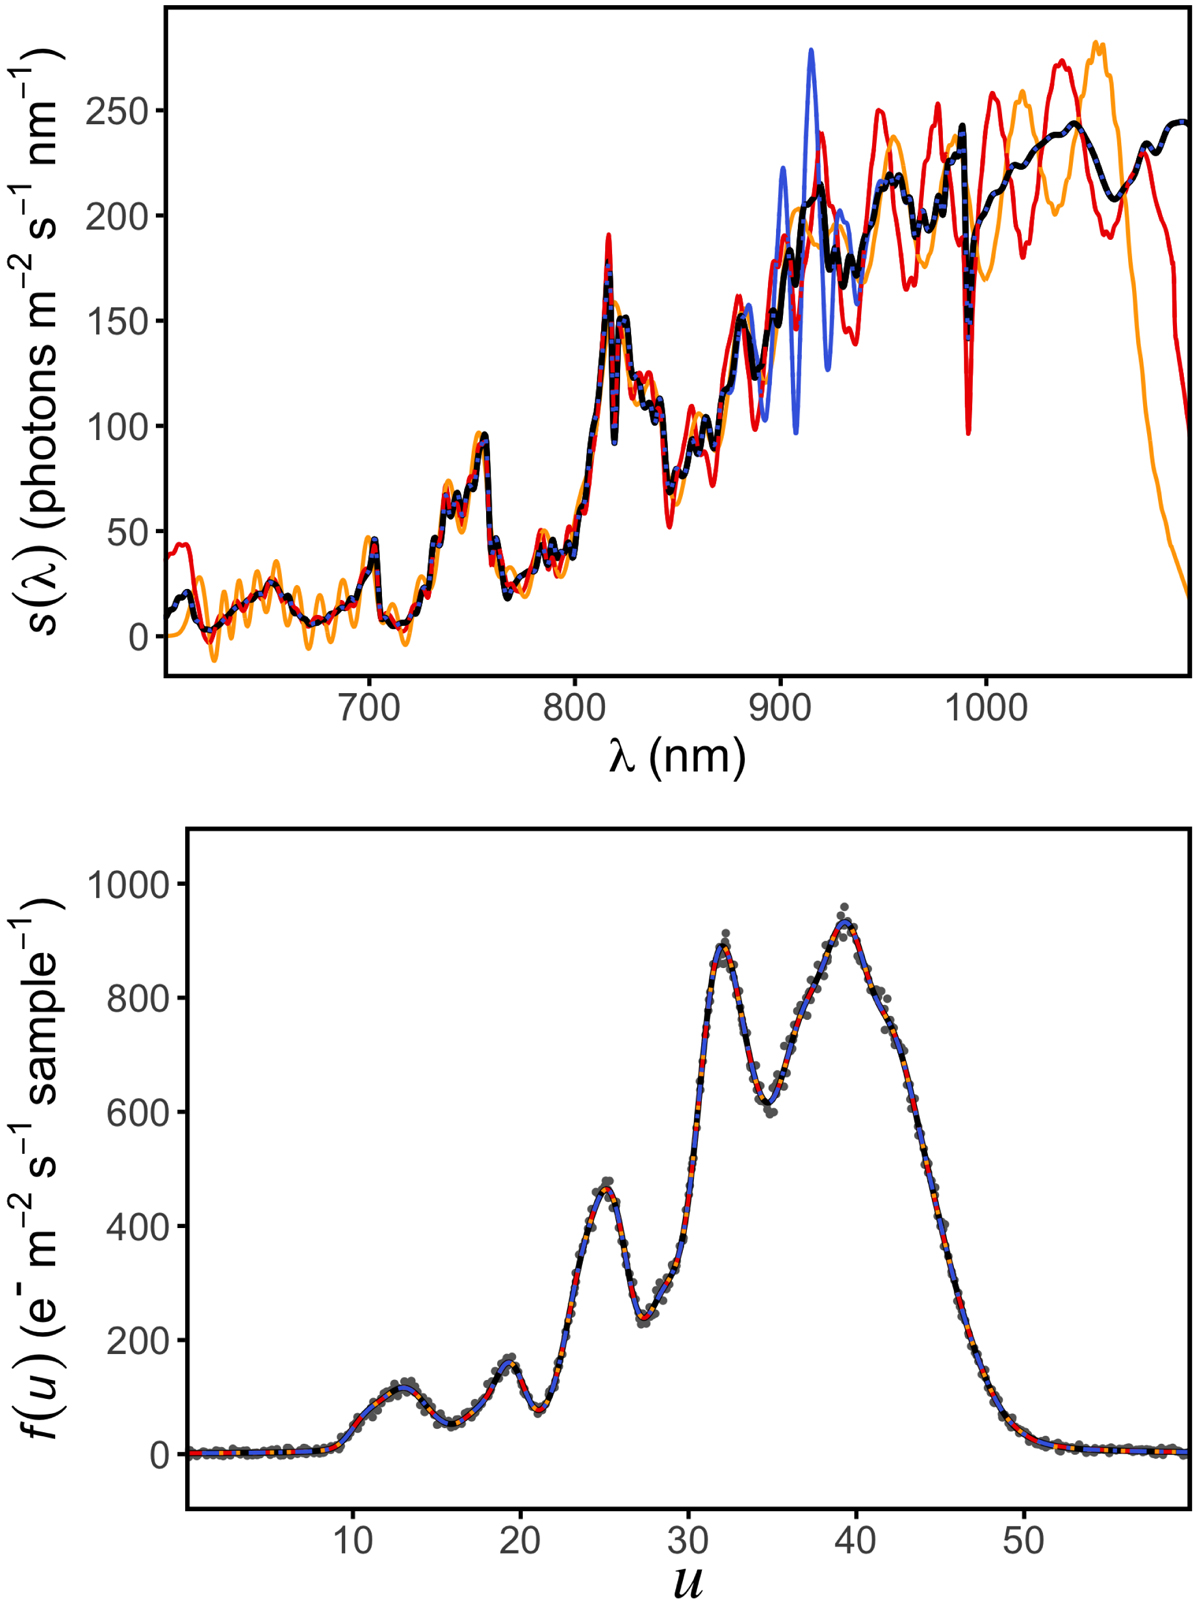
Top panel: SPD of an M-type BaSeL spectrum (black line) and three artificial SEDs (red, orange, and blue lines), scaled to a G magnitude of 16m. Bottom panel: simulated continuous, noise-free observational RP spectra of the SPDs in the upper panel (solid lines; the differences between the lines are too small to be visible). The grey dotted symbols show simulated noisy observations.
Current usage metrics show cumulative count of Article Views (full-text article views including HTML views, PDF and ePub downloads, according to the available data) and Abstracts Views on Vision4Press platform.
Data correspond to usage on the plateform after 2015. The current usage metrics is available 48-96 hours after online publication and is updated daily on week days.
Initial download of the metrics may take a while.