Fig. 15.
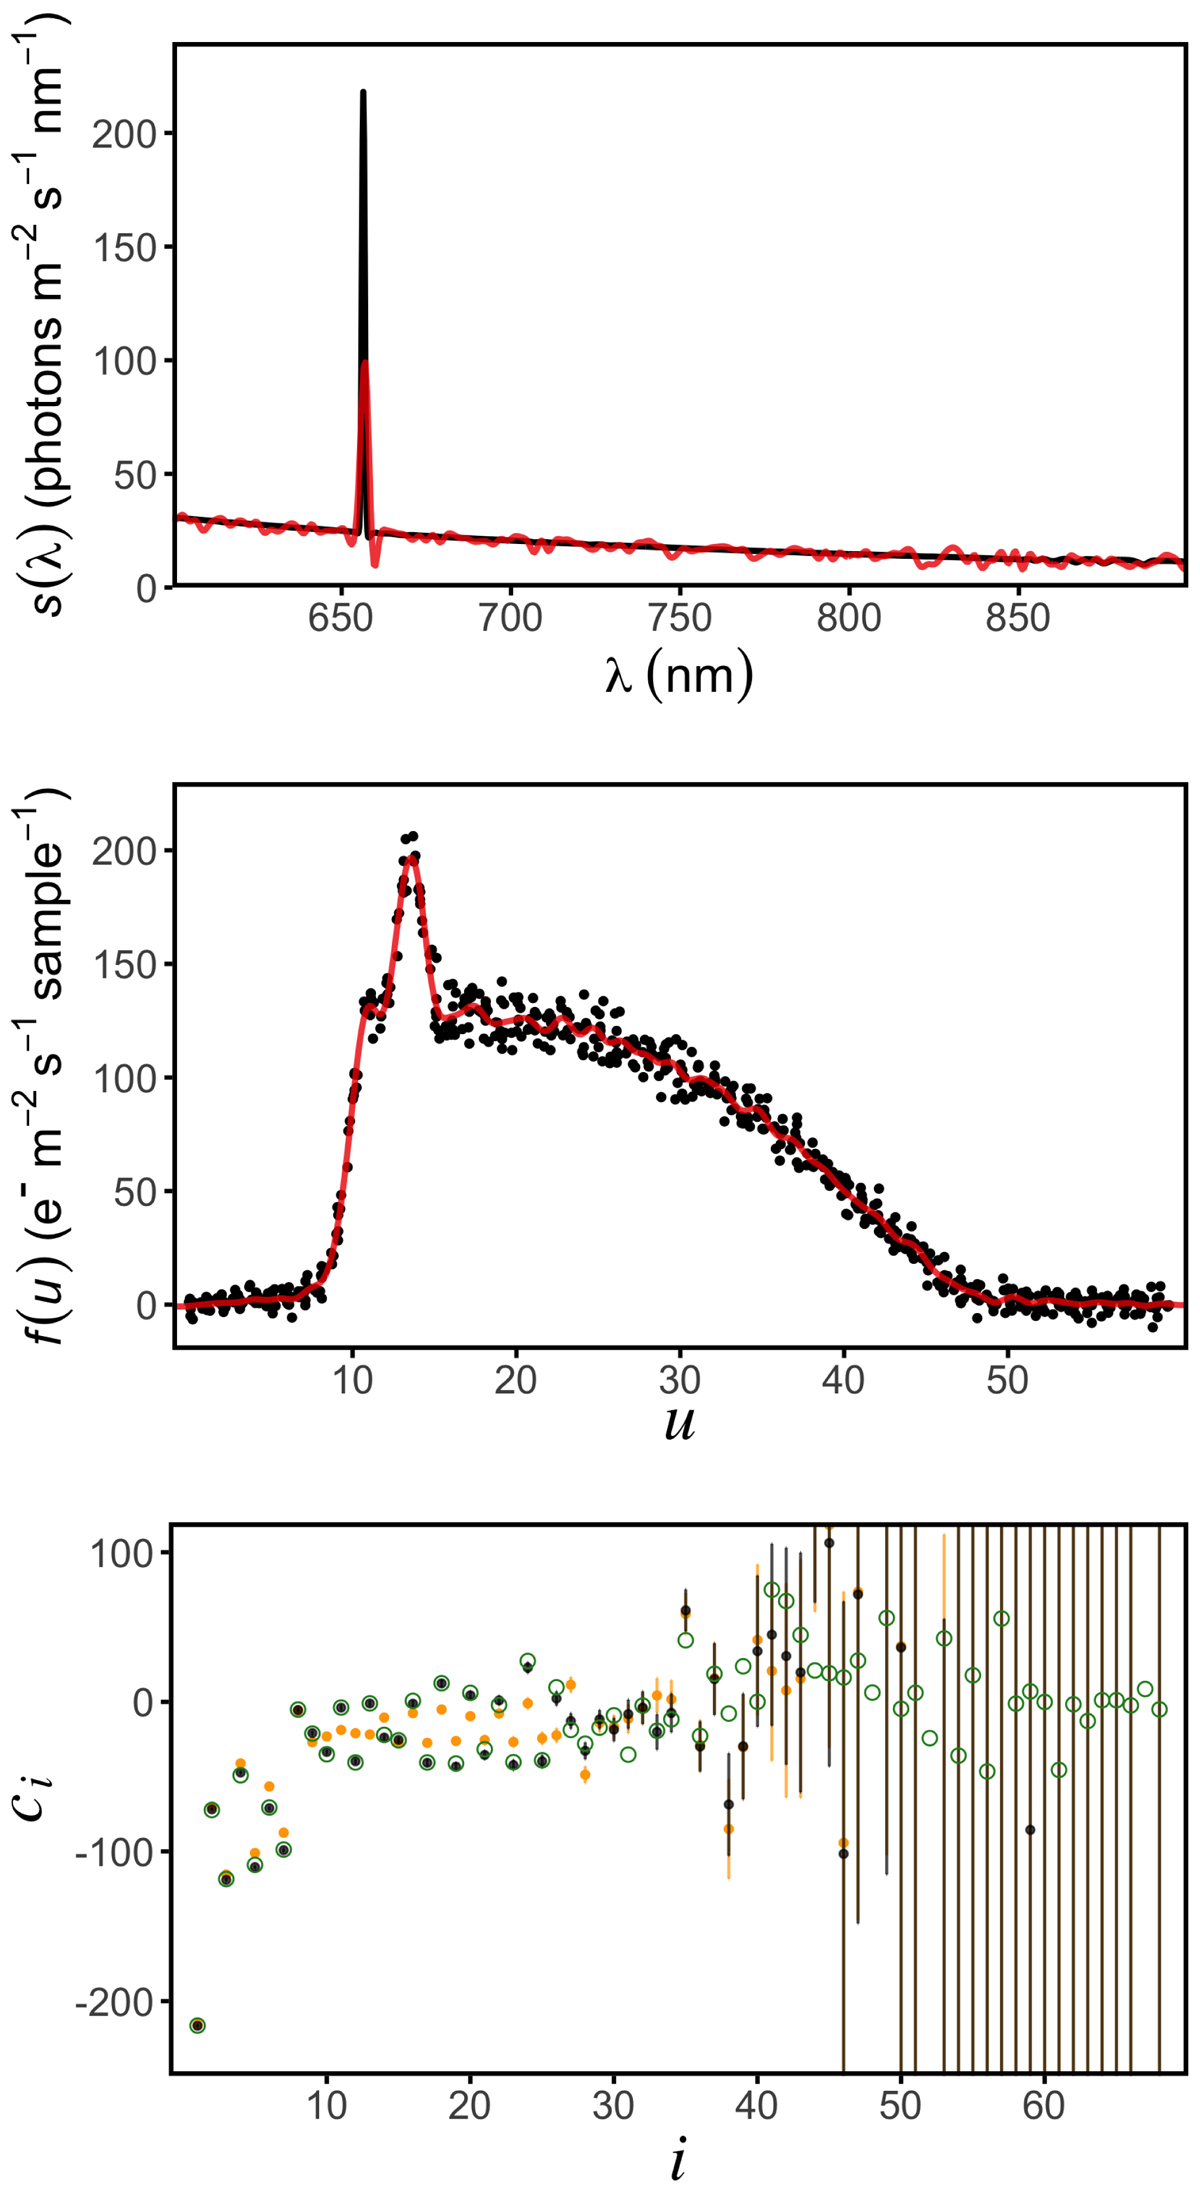
Upper panel: SPD of a B-type star with the added Hα emission line (black line). The projection of this SPD onto the basis of ![]() is shown by the red line. Middle panel: simulated RP observations (black dots) and the forward calibration result (red line). The Hα line is the peak centred at u = 13.6. Bottom panel: coefficients in
is shown by the red line. Middle panel: simulated RP observations (black dots) and the forward calibration result (red line). The Hα line is the peak centred at u = 13.6. Bottom panel: coefficients in ![]() in a reference system in which the covariance matrix diagonalises (black dots). The true coefficients are shown as green circles. The orange dots show the coefficients in the absence of the Hα line.
in a reference system in which the covariance matrix diagonalises (black dots). The true coefficients are shown as green circles. The orange dots show the coefficients in the absence of the Hα line.
Current usage metrics show cumulative count of Article Views (full-text article views including HTML views, PDF and ePub downloads, according to the available data) and Abstracts Views on Vision4Press platform.
Data correspond to usage on the plateform after 2015. The current usage metrics is available 48-96 hours after online publication and is updated daily on week days.
Initial download of the metrics may take a while.