Fig. 14.
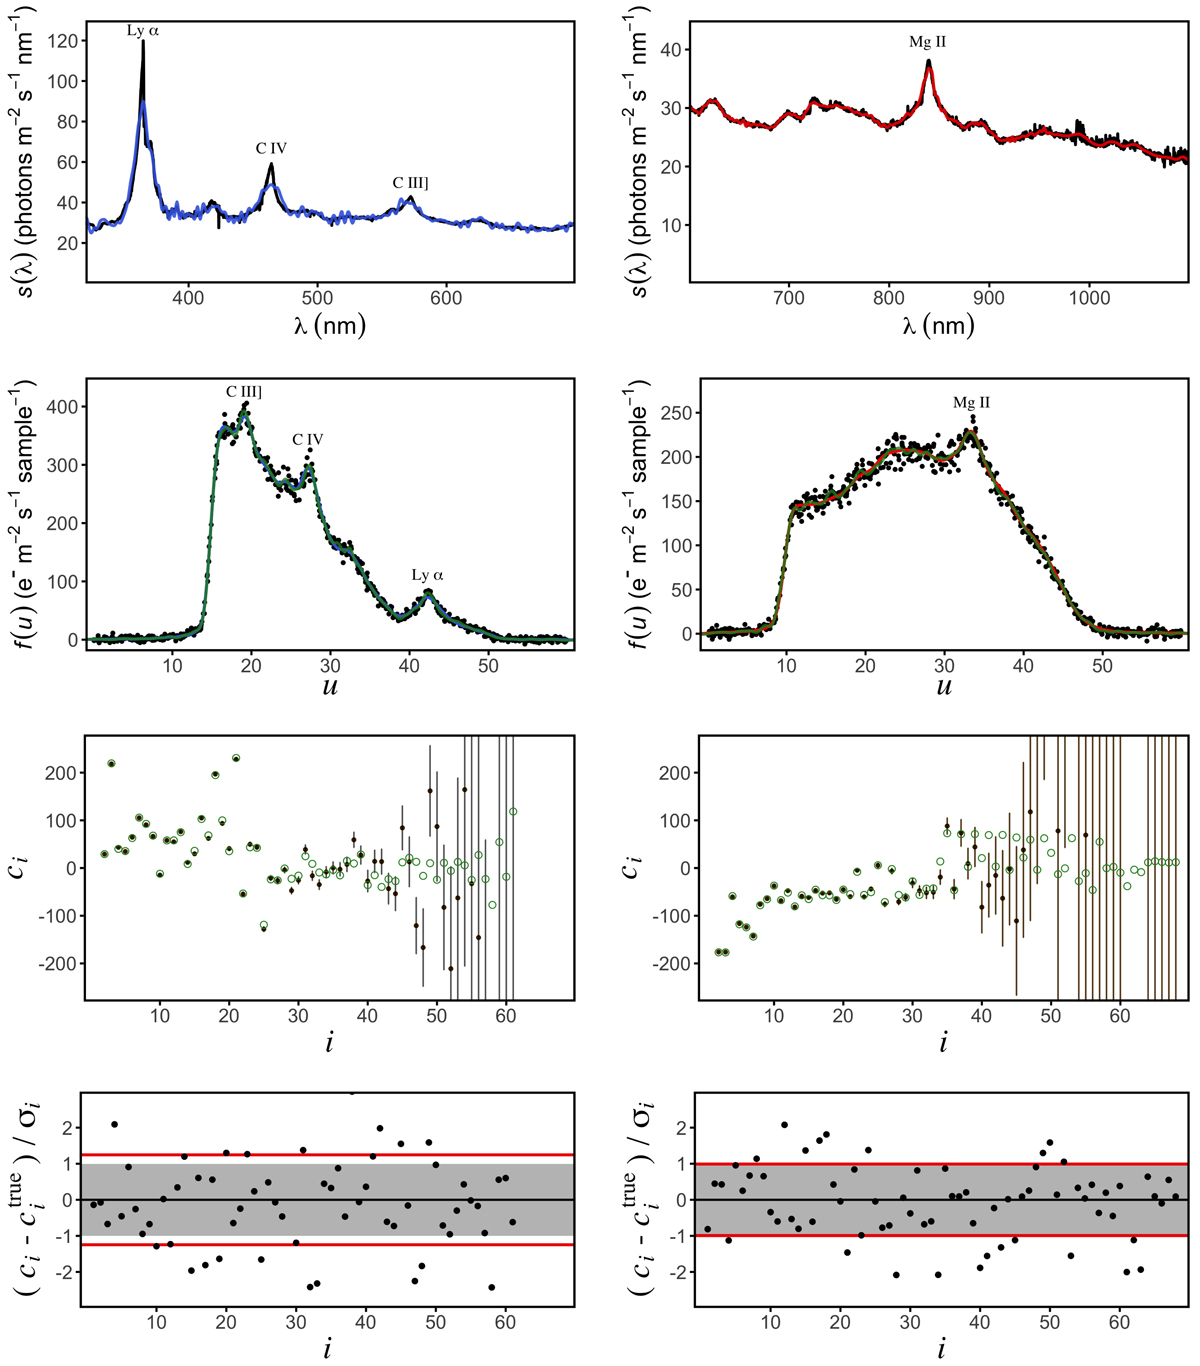
Spectral photon distributions and calibration results for a QSO with G = 16m and z = 2 for BP (left column) and RP (right column). Top row: SPDs (black lines) and their projections onto the bases for ![]() (blue line) and
(blue line) and ![]() (red line). Second row: simulated BP and RP observations (black dots), the result for the observational spectra from the calibration (green lines), and the results for the forward calibration (blue and red lines). Third row: coefficients resulting from the calibration (black symbols) and true coefficients (green symbols). Bottom row: normalised residuals of the coefficients. The red lines give the sample standard deviation.
(red line). Second row: simulated BP and RP observations (black dots), the result for the observational spectra from the calibration (green lines), and the results for the forward calibration (blue and red lines). Third row: coefficients resulting from the calibration (black symbols) and true coefficients (green symbols). Bottom row: normalised residuals of the coefficients. The red lines give the sample standard deviation.
Current usage metrics show cumulative count of Article Views (full-text article views including HTML views, PDF and ePub downloads, according to the available data) and Abstracts Views on Vision4Press platform.
Data correspond to usage on the plateform after 2015. The current usage metrics is available 48-96 hours after online publication and is updated daily on week days.
Initial download of the metrics may take a while.