Fig. 13.
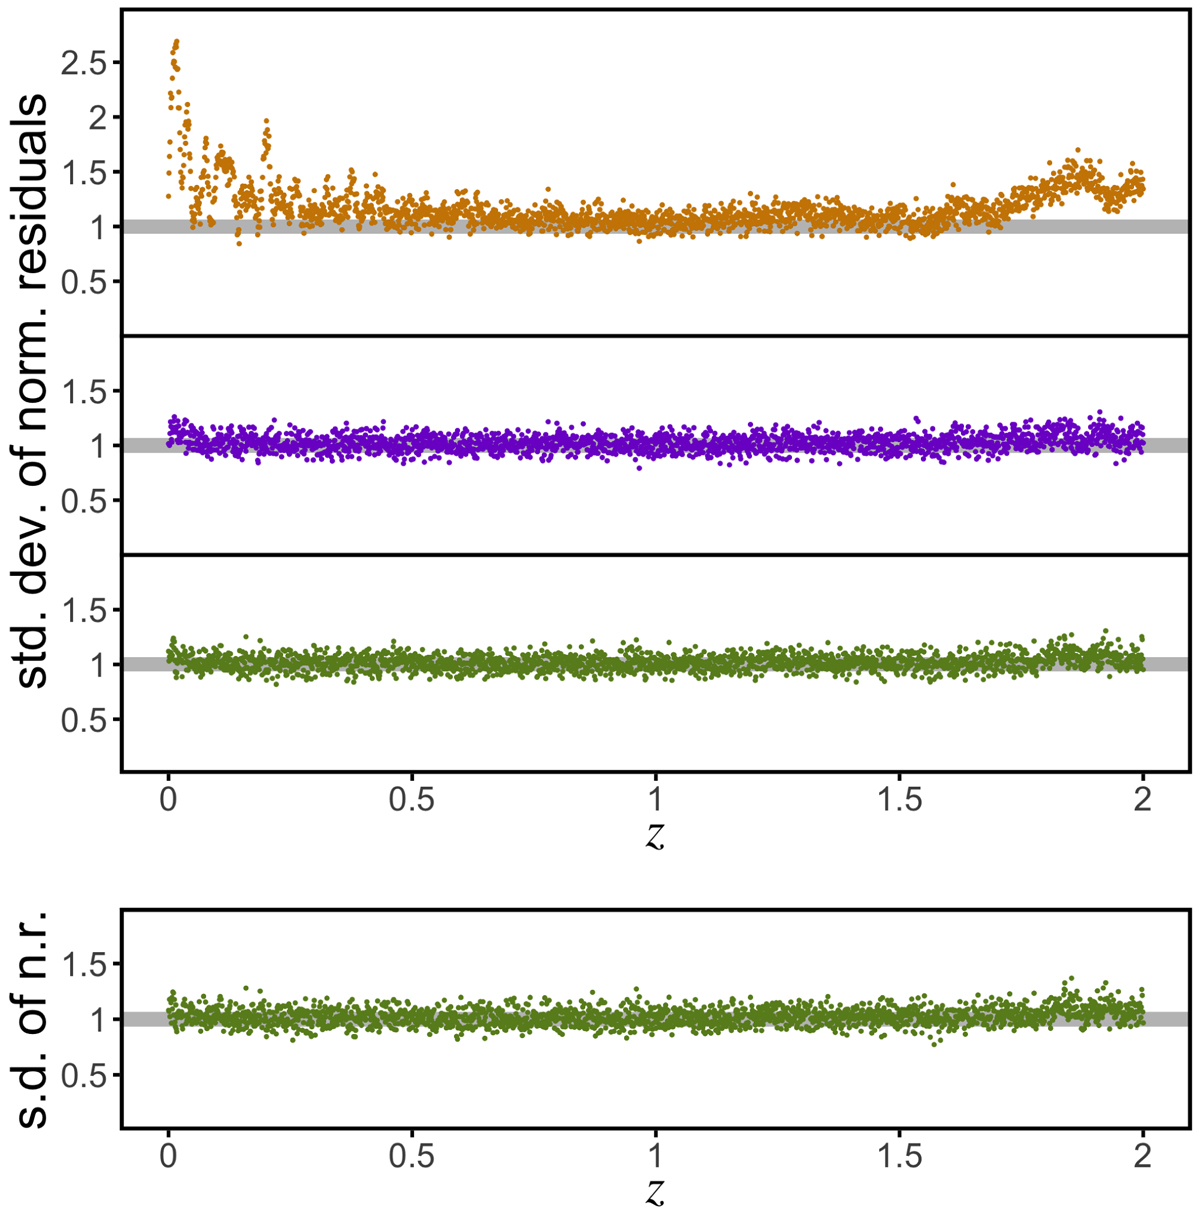
Upper part: standard deviation of the normalised residuals for a model QSO spectrum with G = 17m and redshifts z between 0 and 2. Top panel: basis extension with stellar model spectra. Middle panel: basis extension with B-splines. Bottom panel: basis extension with both model spectra and B-splines. The grey shaded region indicates the standard error of the standard deviation. Lower part: same as the bottom panel of the upper part, but for the defocus test.
Current usage metrics show cumulative count of Article Views (full-text article views including HTML views, PDF and ePub downloads, according to the available data) and Abstracts Views on Vision4Press platform.
Data correspond to usage on the plateform after 2015. The current usage metrics is available 48-96 hours after online publication and is updated daily on week days.
Initial download of the metrics may take a while.