Fig. 11.
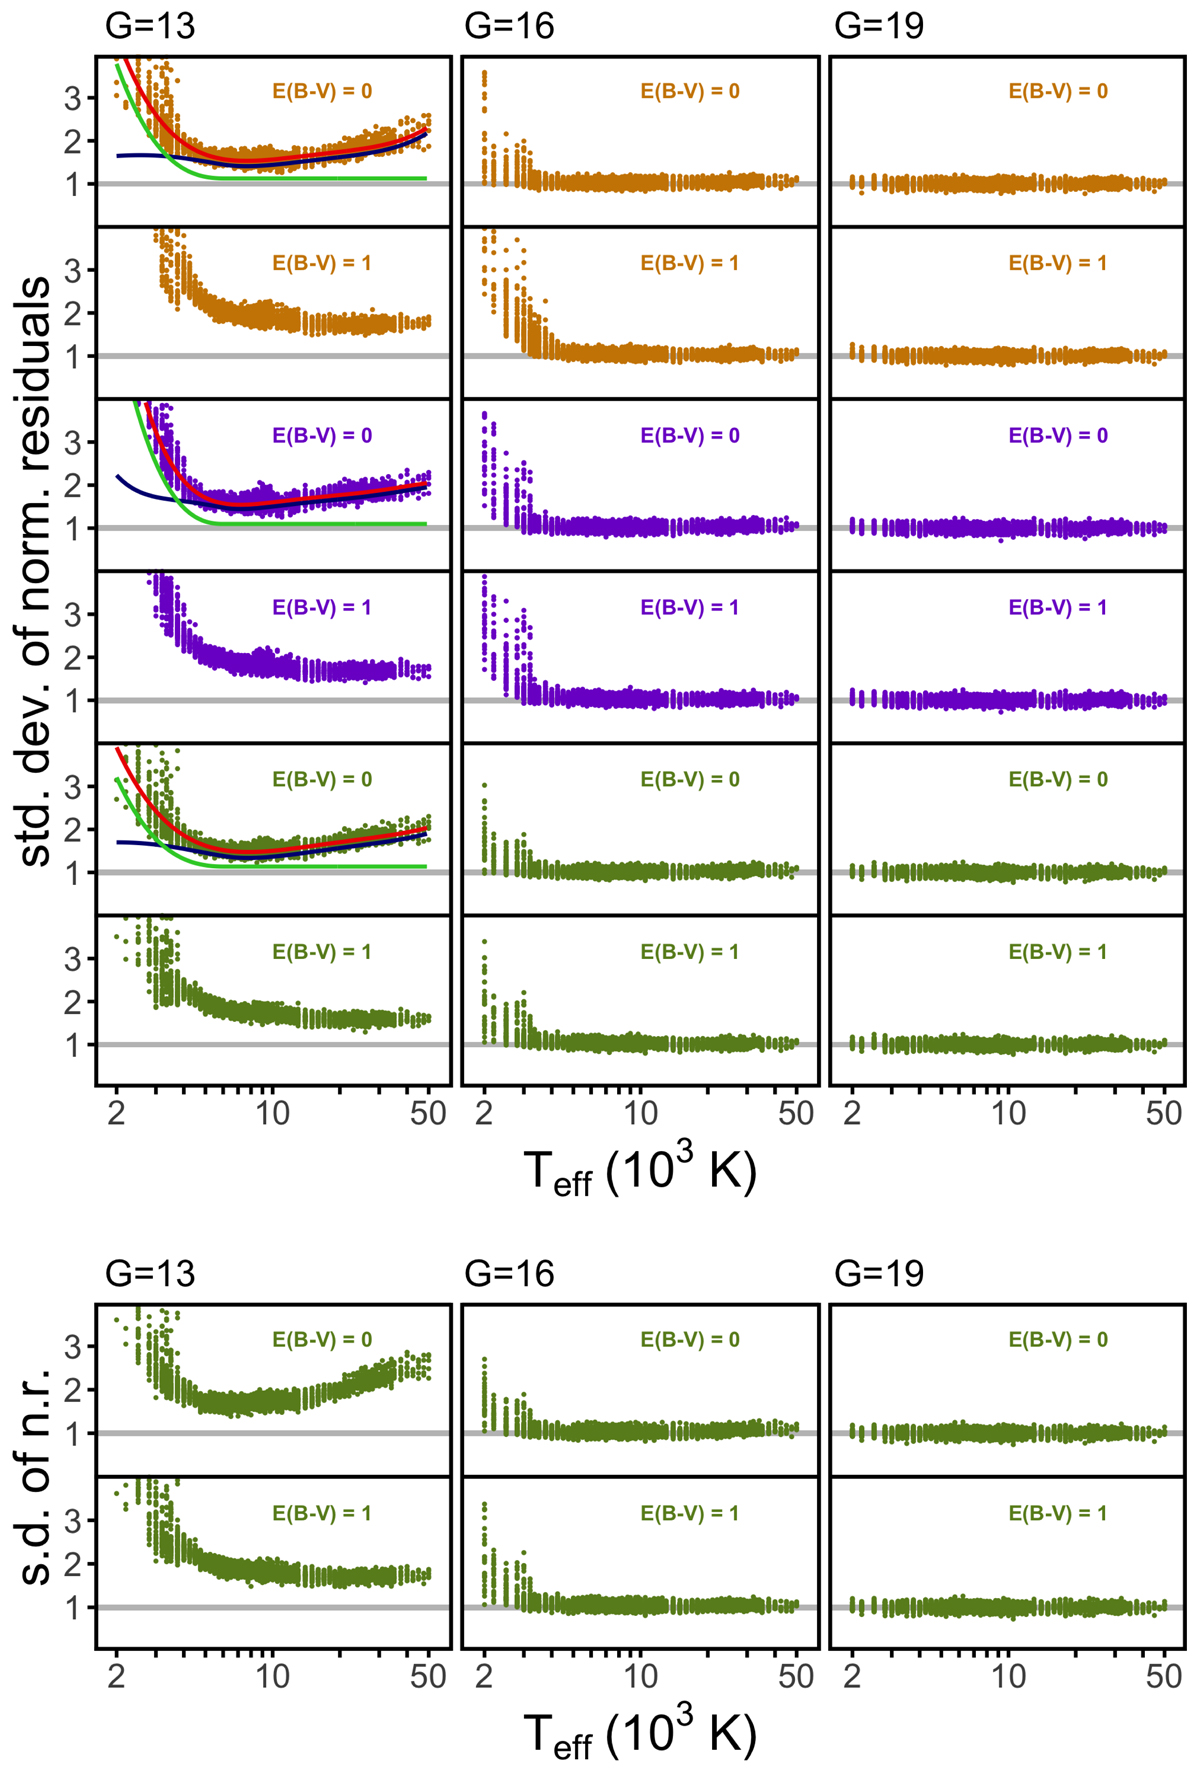
Upper panel: standard deviations of the normalised residuals for all stars in the test set. The three columns correspond to G magnitudes of 13, 16, and 19. The top two panels show results for a basis expansion using stellar model spectra, the central two panels using B-splines, and the bottom two using a combination of stellar model spectra and B-splines. For each approach for the basis expansion, the results for unreddened stars (E(B − V) = 0) and reddened stars (using E(B − V) = 1) are shown. The grey shaded region indicates the standard error of the standard deviation. For the case of G = 13m and E(B − V) = 0, lines indicate the approximate contributions of the limitations by the breakdown (green lines) and the error in the instrument matrix (blue lines) to the total systematic error (red lines). Lower panel: same as the bottom two rows of the upper panel, but for the defocus test.
Current usage metrics show cumulative count of Article Views (full-text article views including HTML views, PDF and ePub downloads, according to the available data) and Abstracts Views on Vision4Press platform.
Data correspond to usage on the plateform after 2015. The current usage metrics is available 48-96 hours after online publication and is updated daily on week days.
Initial download of the metrics may take a while.