Free Access
Fig. 3.
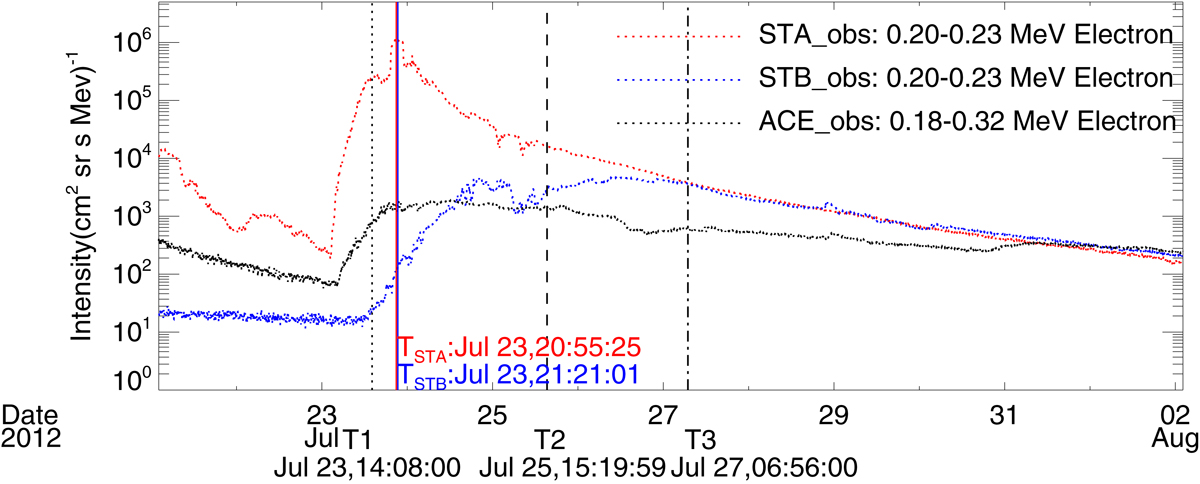
Time profile of electron fluxes by the multi-spacecraft observation during the 23 July 2012 SEP event. The black, red, and blue dotted curves correspond to the observations of 0.18 − 0.32 MeV electrons on ACE, and 0.2 − 0.23 MeV electrons on STEREO-A and STEREO-B.
Current usage metrics show cumulative count of Article Views (full-text article views including HTML views, PDF and ePub downloads, according to the available data) and Abstracts Views on Vision4Press platform.
Data correspond to usage on the plateform after 2015. The current usage metrics is available 48-96 hours after online publication and is updated daily on week days.
Initial download of the metrics may take a while.