Fig. 2.
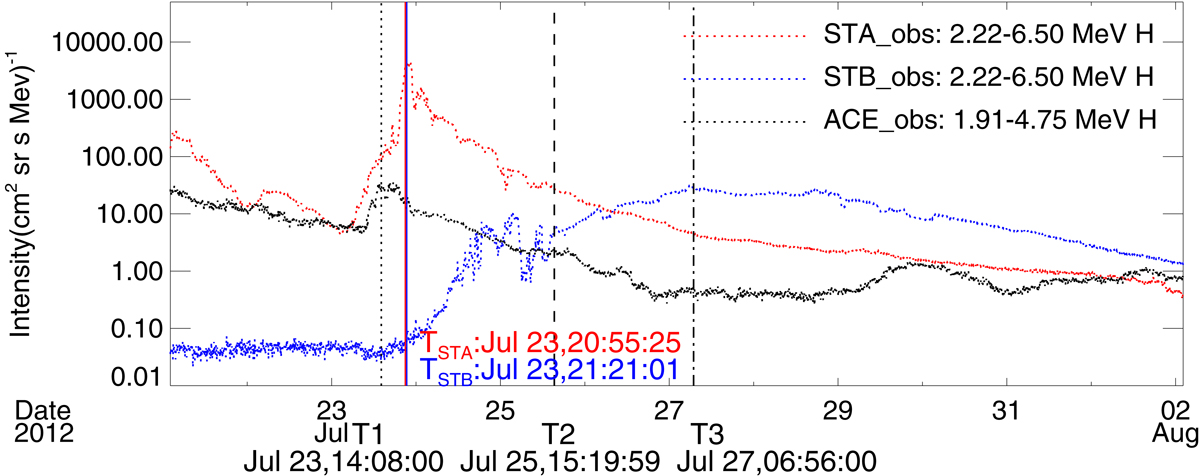
Time profile of proton fluxes by the multi-spacecraft observation during the 23 July 2012 SEP event. The black, red, and blue dotted curves correspond to the observations of 1.91 − 4.75 MeV protons by the EPAM instrument onboard ACE, and 2.2 − 6.5 MeV protons by the SEPT instruments onboard STEREO-A and STEREO-B, respectively. The red and blue vertical lines indicate the shock arrival time, 20:55 UT on STEREO-A and 21:21 UT on STEREO-B respectively. The dotted line, dashed line, and dot-dash line indicate the time T1, July 23, 14:08:00, T2, July 25, 15:19:59, and T3, July 27, 06:56:00.
Current usage metrics show cumulative count of Article Views (full-text article views including HTML views, PDF and ePub downloads, according to the available data) and Abstracts Views on Vision4Press platform.
Data correspond to usage on the plateform after 2015. The current usage metrics is available 48-96 hours after online publication and is updated daily on week days.
Initial download of the metrics may take a while.