Fig. B.1
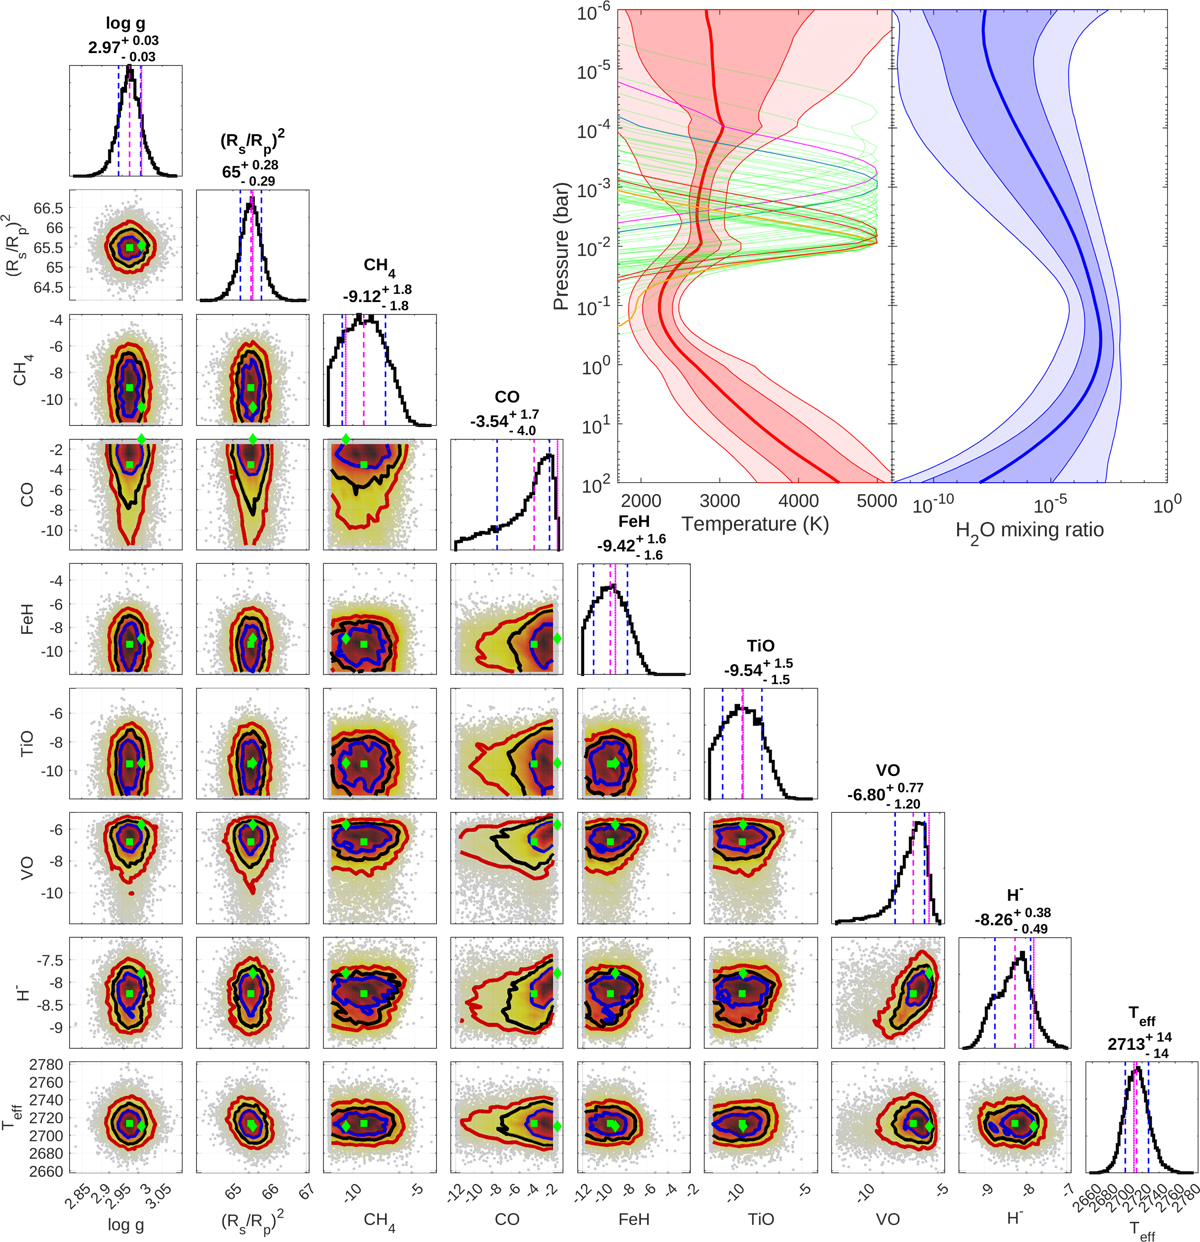
Posterior distributions for the retrieval of the WASP-121b emission spectrum using Helios-r.2. The magenta dashed lines in the posterior plots refer to the location of the median value (also stated below each parameter), while the 1σ confidence limit is denoted by the blue dashed lines. The magenta dotted line shows the location of the best-fit model (i.e., the one with highest likelihood value). The molecular abundances are stated in logarithmicunits. The blue, red, and yellow solid lines in the 2D parameter correlation plots mark the 1σ, 2σ, and 3σ intervals, respectively. Here, the location of the median (best-fit) model is indicated by green squares (diamonds). It should be noted that Teff is not a directly retrieved parameter, but a derived quantity. The panel in the upper right corner depicts the retrieved temperatureprofile. The red solid line corresponds to the median profile, while the red shaded areas correspond to the 1σ and 2σ confidence intervals. The distribution functions of the various data are displayed as thin lines, with the same color-coding as in Fig. 4
Current usage metrics show cumulative count of Article Views (full-text article views including HTML views, PDF and ePub downloads, according to the available data) and Abstracts Views on Vision4Press platform.
Data correspond to usage on the plateform after 2015. The current usage metrics is available 48-96 hours after online publication and is updated daily on week days.
Initial download of the metrics may take a while.