Fig. 4
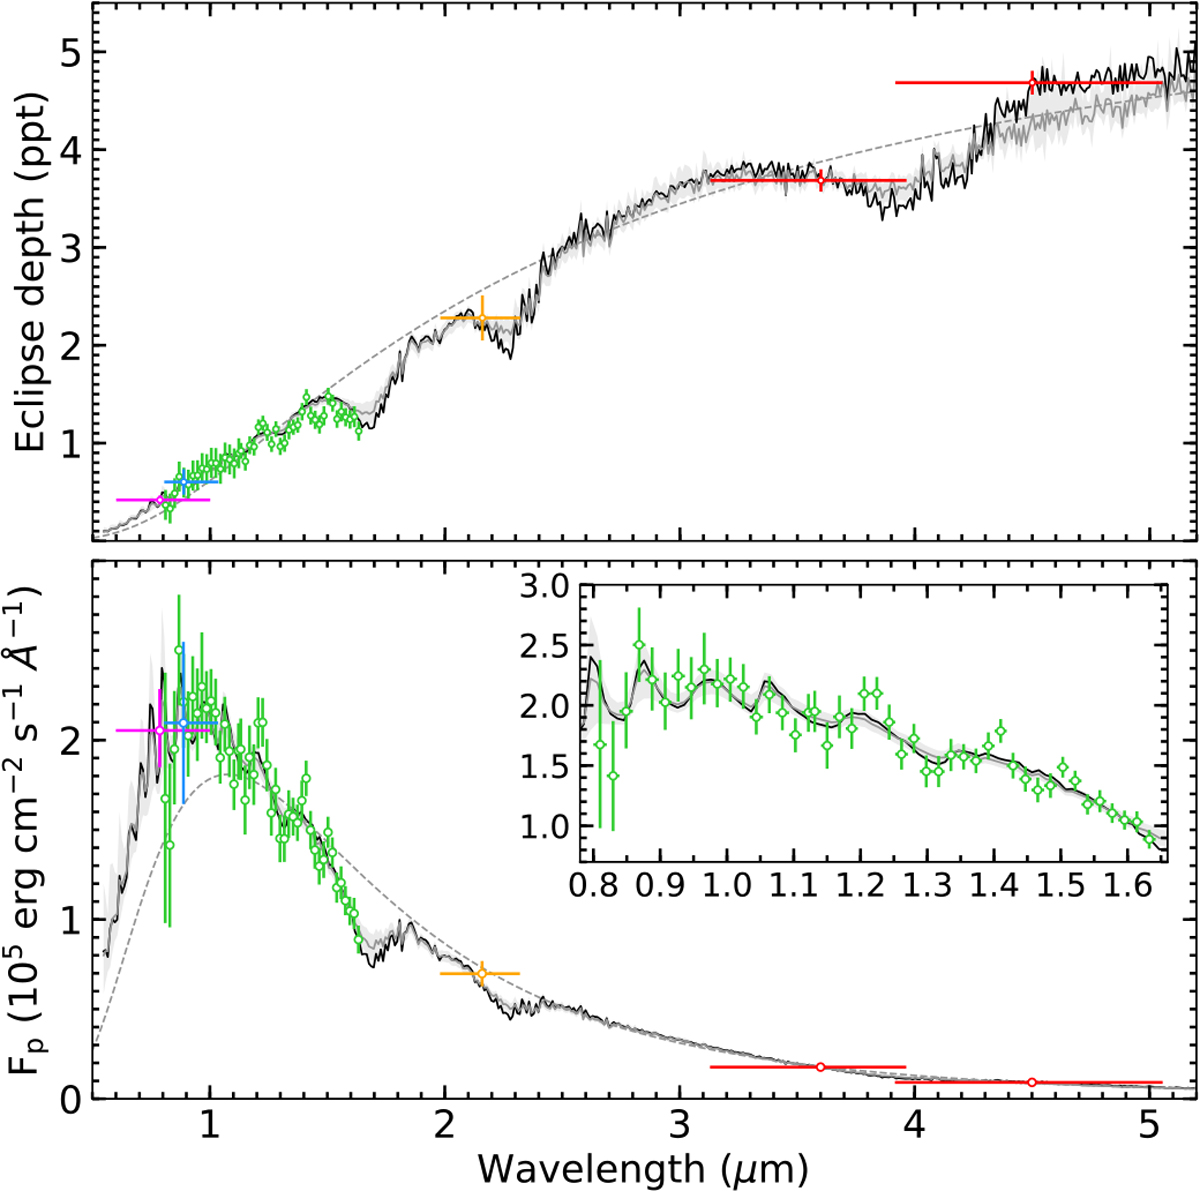
Eclipse depths and emission spectrum of WASP-121b at optical and infrared wavelengths. Top panel: planet-to-star flux ratios measured with TESS (purple), TRAPPIST (Sloan-z′ band, blue), HST (WFC3, green), SMARTS’ (2MASS K band, orange), and Spitzer (IRAC, red). Horizontal bars indicate the bandpasses of the instruments. Bottom panel: corresponding planetary emission spectrum, with flux defined at the TESS planet radius. In both panels, the gray dashed line shows the best-fit isothermal blackbody spectrum, and the black solid line the best-fit model from our retrieval analysis. The shaded region is the 1σ envelope of all spectra derived from the posterior distributions, and the gray solid line is the corresponding median spectrum. For the sake of clarity, all original high-resolution spectra have been binned down to a lower resolution. The inset shows a magnification of the WFC3 wavelength range.
Current usage metrics show cumulative count of Article Views (full-text article views including HTML views, PDF and ePub downloads, according to the available data) and Abstracts Views on Vision4Press platform.
Data correspond to usage on the plateform after 2015. The current usage metrics is available 48-96 hours after online publication and is updated daily on week days.
Initial download of the metrics may take a while.