Fig. 9.
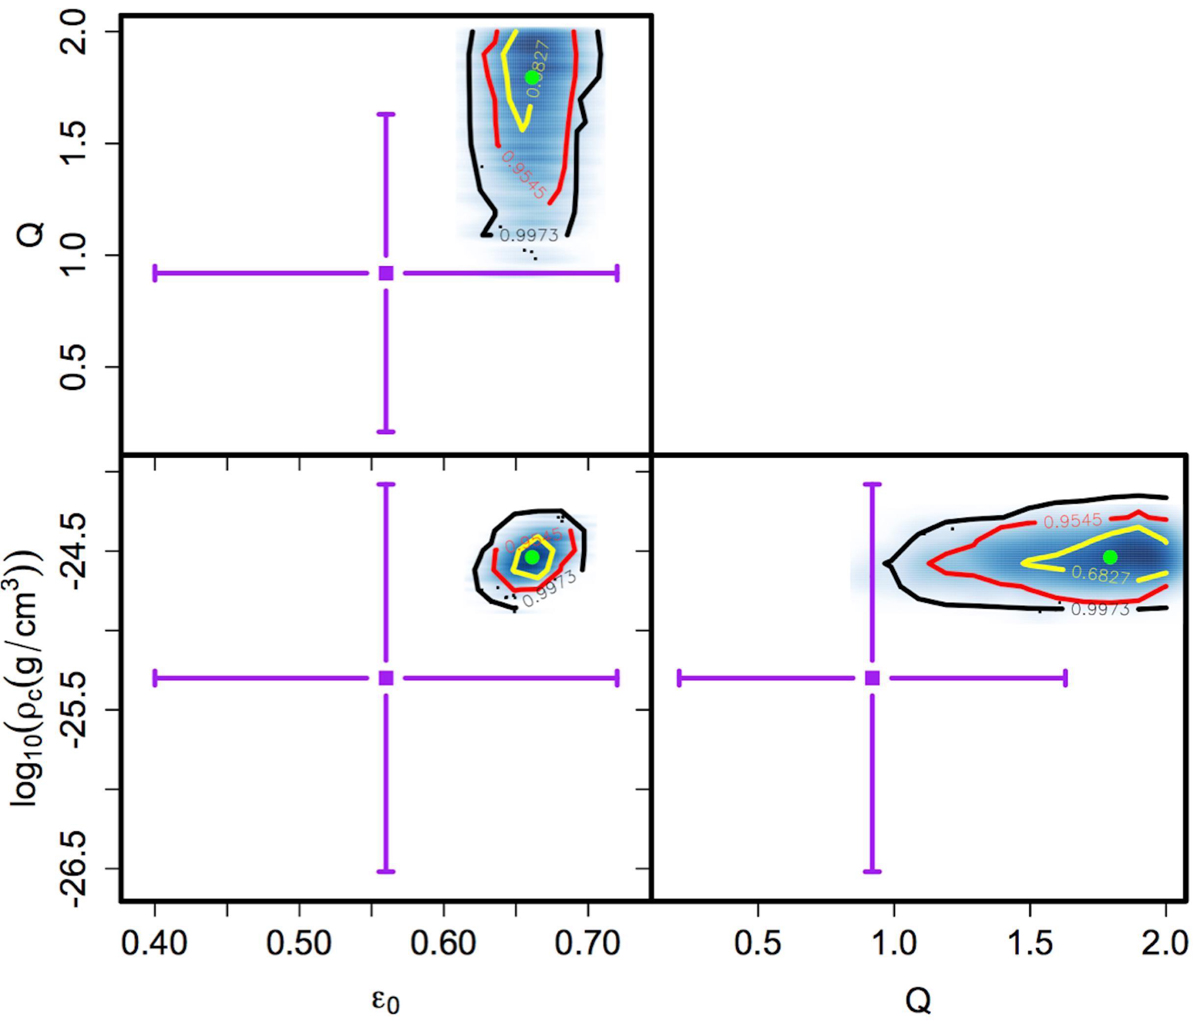
Posterior distributions of the three RG parameters. The green dots locate the median values and the yellow, red, and black contours show the 1σ, 2σ, and 3σ levels, respectively. The purple points and error bars show the means of the distributions of the RG parameters and their mean uncertainties found in Sect. 4 and reported in Fig. 8.
Current usage metrics show cumulative count of Article Views (full-text article views including HTML views, PDF and ePub downloads, according to the available data) and Abstracts Views on Vision4Press platform.
Data correspond to usage on the plateform after 2015. The current usage metrics is available 48-96 hours after online publication and is updated daily on week days.
Initial download of the metrics may take a while.