Fig. 8.
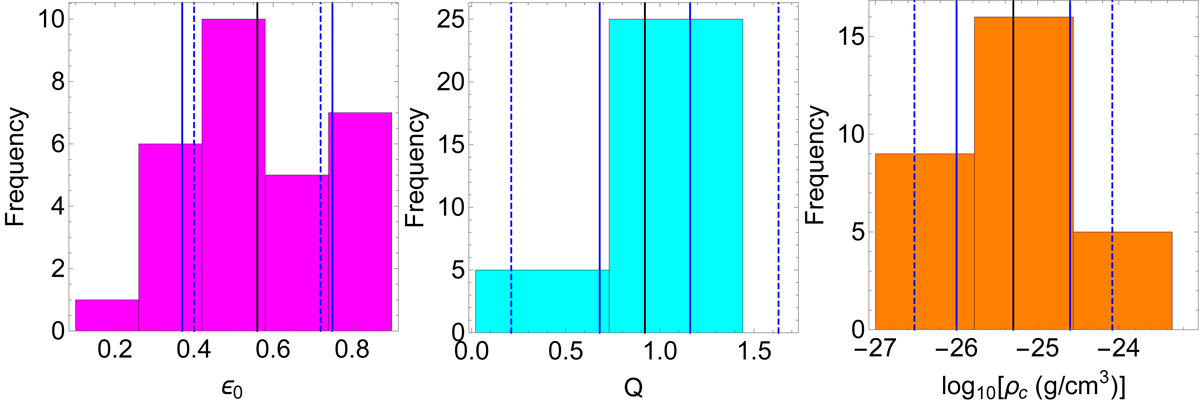
Distributions of the three RG parameters ϵ0, Q, and log10ρc listed in Table 2. The bin sizes are of the order of the mean uncertainties. The means of the distributions are shown as black solid lines; the two blue solid lines show the standard deviations of the distributions; the two blue dashed lines show the mean uncertainties of the parameters listed in Table 2.
Current usage metrics show cumulative count of Article Views (full-text article views including HTML views, PDF and ePub downloads, according to the available data) and Abstracts Views on Vision4Press platform.
Data correspond to usage on the plateform after 2015. The current usage metrics is available 48-96 hours after online publication and is updated daily on week days.
Initial download of the metrics may take a while.