Free Access
Fig. 5.
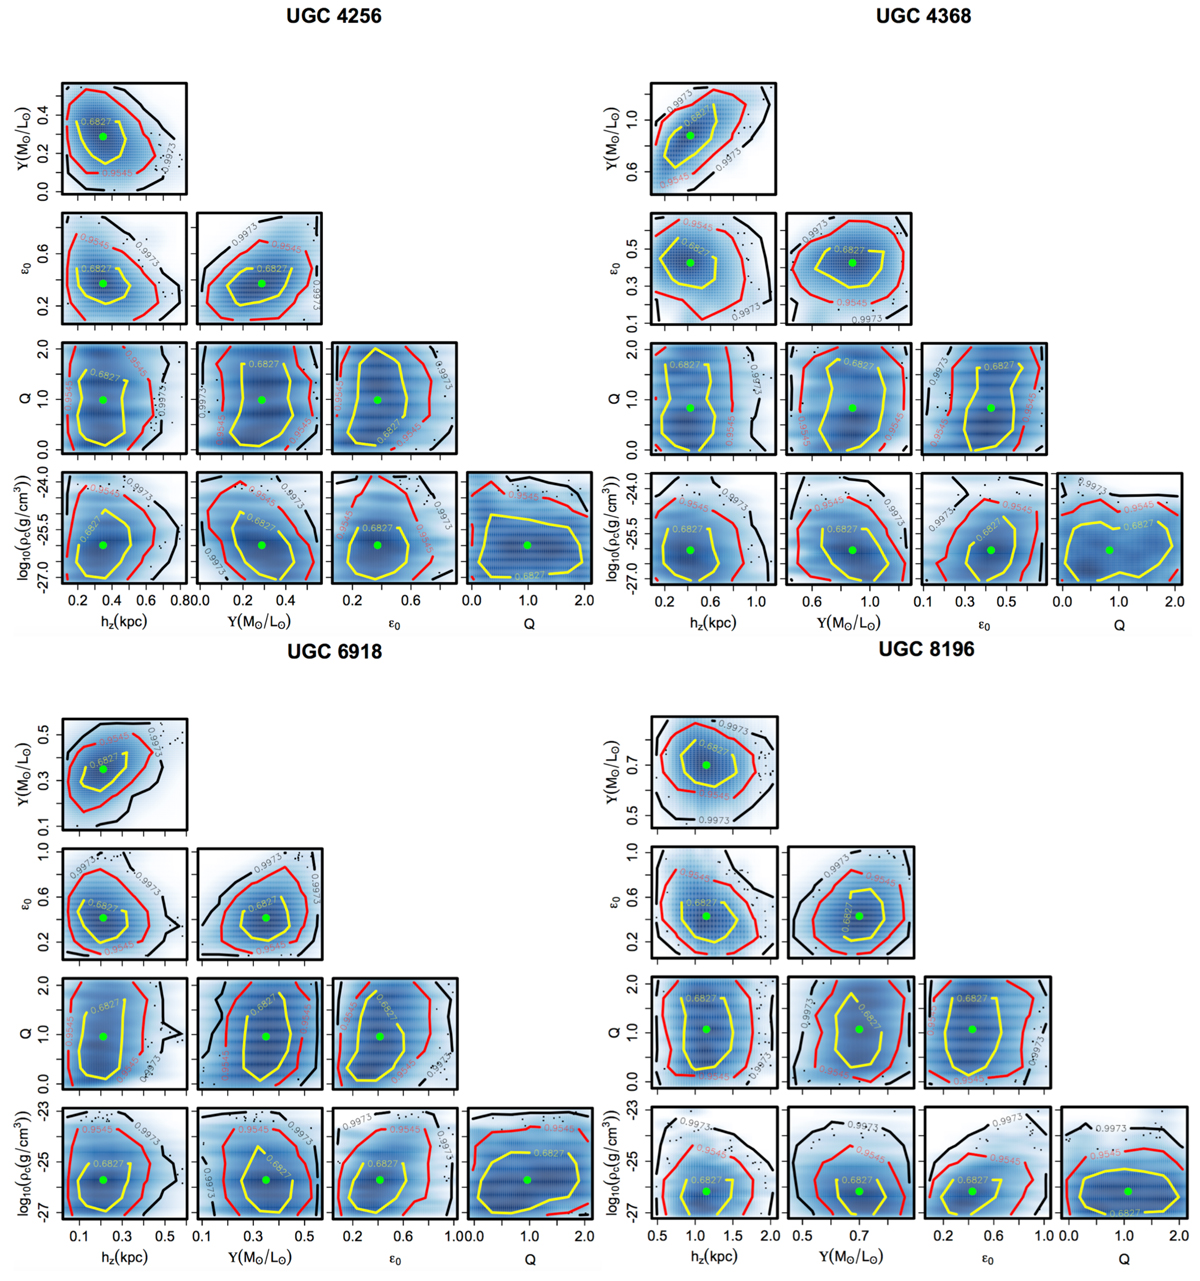
Four examples of posterior distributions of the two galaxy parameters and of the three RG parameters estimated from the rotation curves and the vertical velocity dispersion profiles at the same time. The green dots locate the median values and the yellow, red and black contours show the 1σ, 2σ and 3σ levels, respectively.
Current usage metrics show cumulative count of Article Views (full-text article views including HTML views, PDF and ePub downloads, according to the available data) and Abstracts Views on Vision4Press platform.
Data correspond to usage on the plateform after 2015. The current usage metrics is available 48-96 hours after online publication and is updated daily on week days.
Initial download of the metrics may take a while.