Fig. 11.
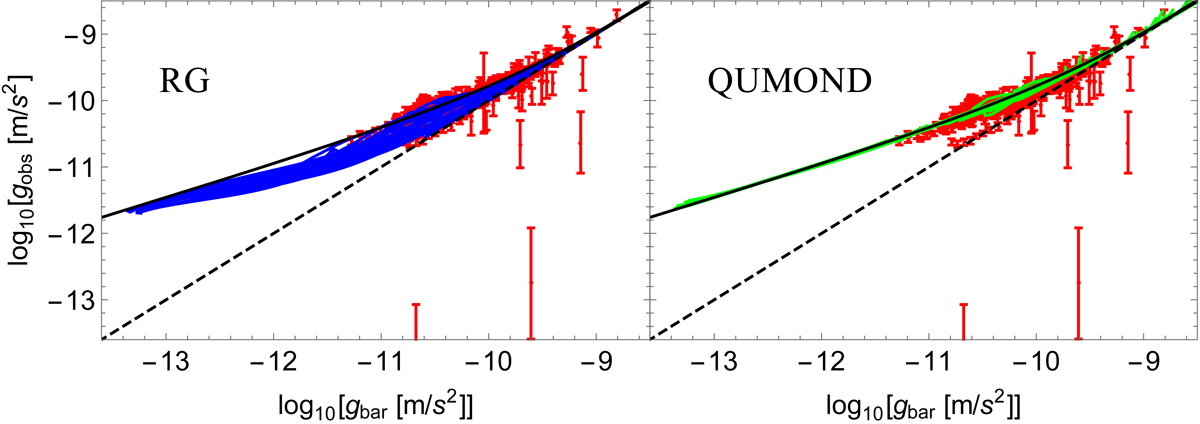
RG (left panel) and QUMOND (right panel) models of the RAR obtained for each galaxy with the parameters derived from the MCMC analysis of the rotation curves and vertical velocity dispersion profiles (Sect. 4). Red points with error bars are the DMS measures. The black solid line is Eq. (20). The black dashed line is gobs = gbar.
Current usage metrics show cumulative count of Article Views (full-text article views including HTML views, PDF and ePub downloads, according to the available data) and Abstracts Views on Vision4Press platform.
Data correspond to usage on the plateform after 2015. The current usage metrics is available 48-96 hours after online publication and is updated daily on week days.
Initial download of the metrics may take a while.