Fig. 12.
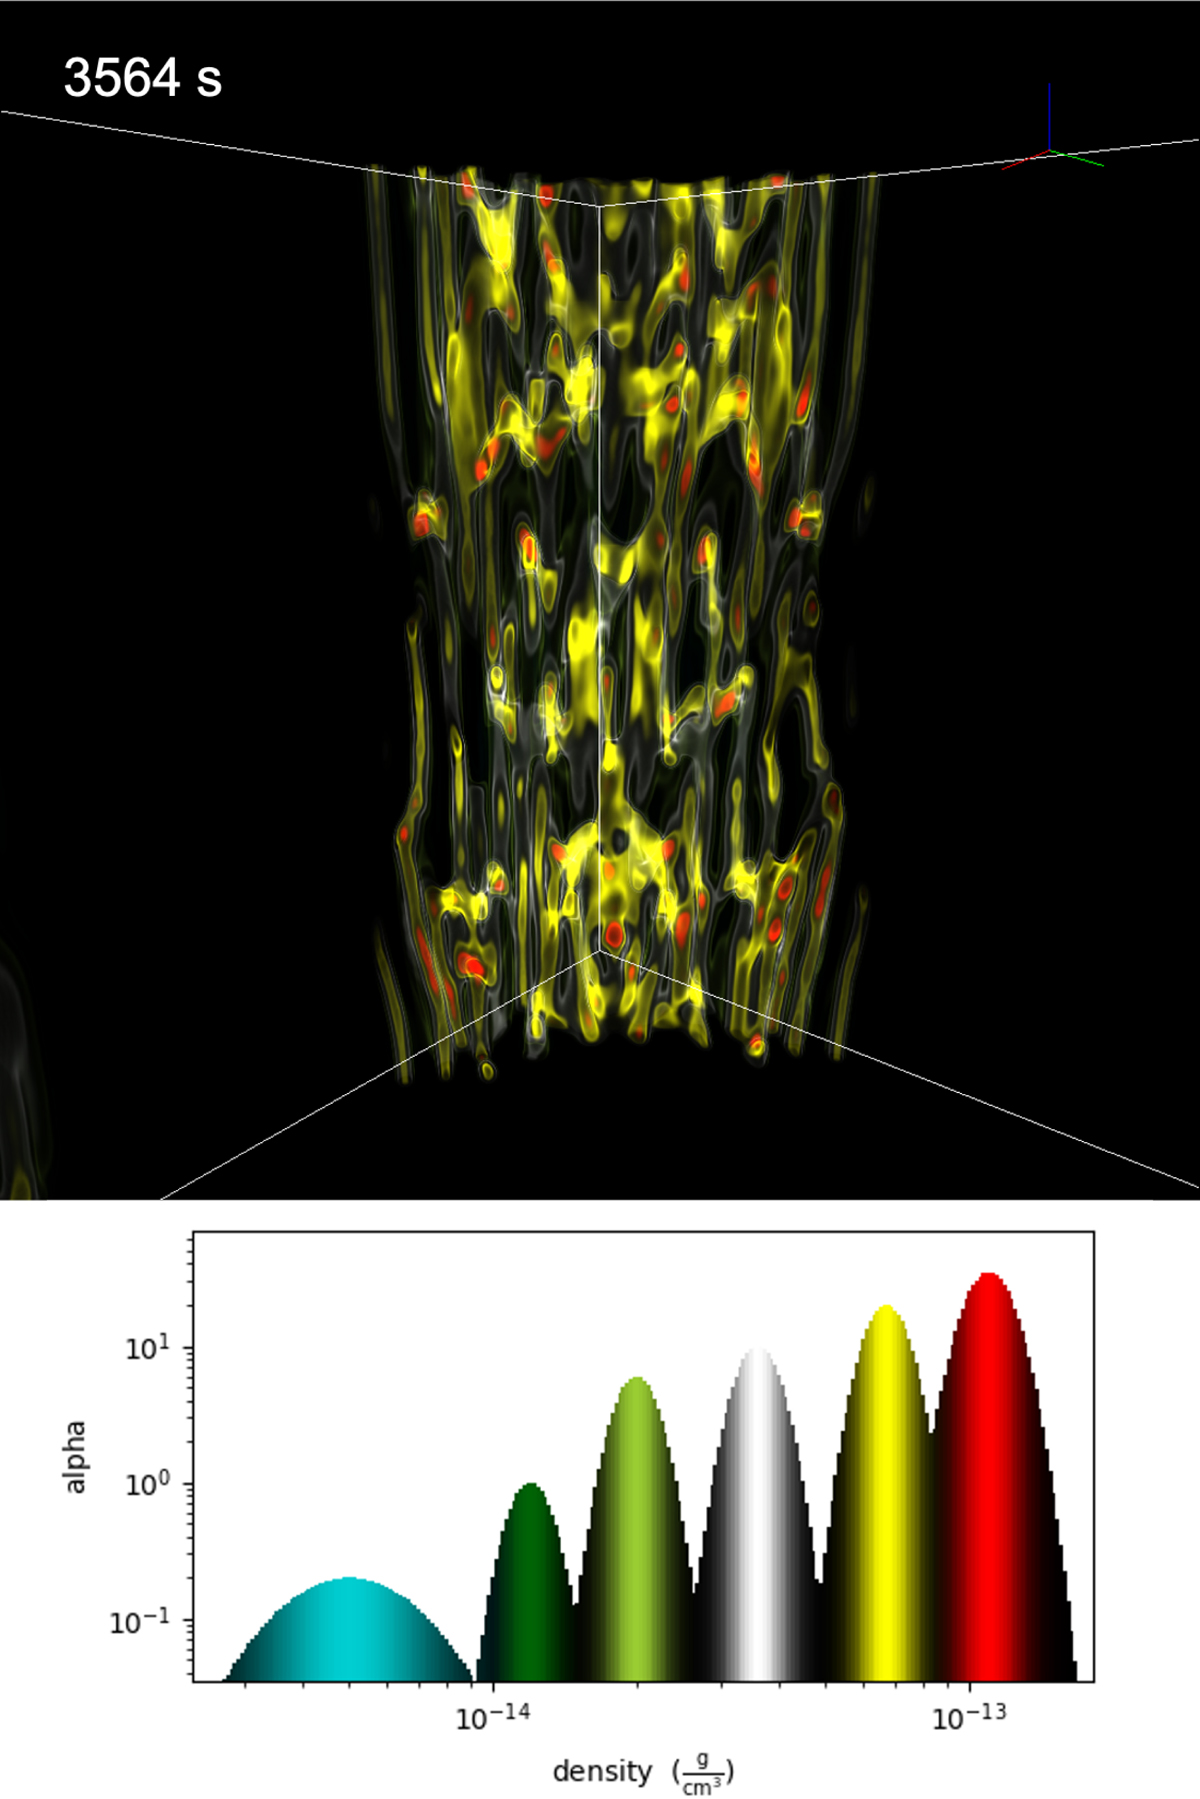
Volume rendering of the filamentary fine structure at t≈ 0.99 h (last snapshot). The transfer function is customised and tweaked to highlight high-density regions and is shown on the bottom panel. The solid white lines denote the domain boundaries. This rendering was made by yt (Turk et al. 2011) using the newly developed AMRVAC frontend. (An animation of this figure is available online.)
Current usage metrics show cumulative count of Article Views (full-text article views including HTML views, PDF and ePub downloads, according to the available data) and Abstracts Views on Vision4Press platform.
Data correspond to usage on the plateform after 2015. The current usage metrics is available 48-96 hours after online publication and is updated daily on week days.
Initial download of the metrics may take a while.