Fig. 18
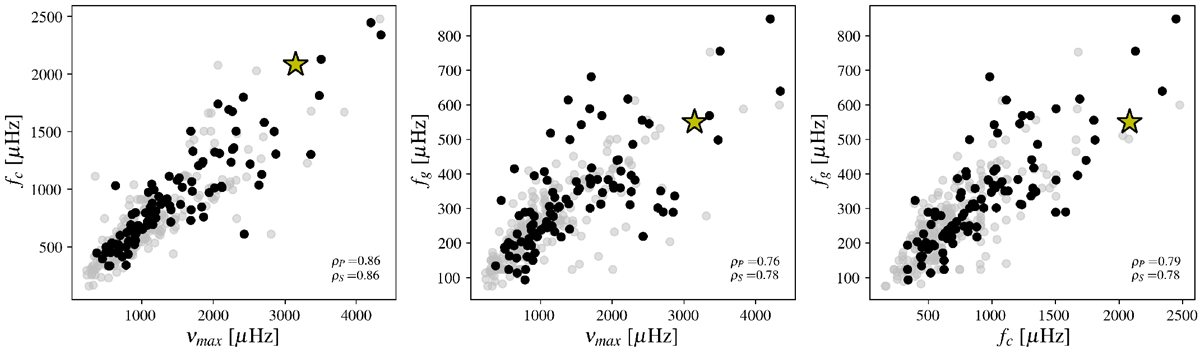
Correlations between νmax (determined using Eq. (4)), the corner frequency, and the flicker frequency. The corner and flicker frequencies have been derived for each Kepler target using the MCMC analysis described in Sect. 4.2. The color code indicates the apparent magnitude of the target: mv < 10 (black) and mv > 10 (gray). Solar values derived from VIRGO observations are shown by the yellow star in each panel. Pearson (ρP) and Spearman’s (ρS) coefficients associated with these plots are indicated on each panel.
Current usage metrics show cumulative count of Article Views (full-text article views including HTML views, PDF and ePub downloads, according to the available data) and Abstracts Views on Vision4Press platform.
Data correspond to usage on the plateform after 2015. The current usage metrics is available 48-96 hours after online publication and is updated daily on week days.
Initial download of the metrics may take a while.