Fig. 17
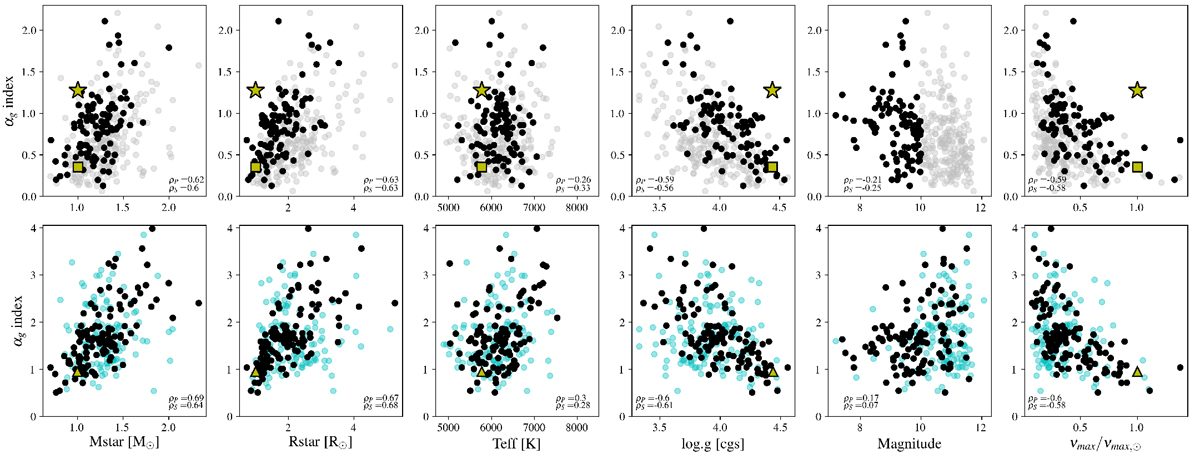
Estimated flicker index associated to granulation (αg) as a function of stellar parameters. From left to right: stellar mass, radius, effective temperature, surface gravity, apparent magnitude, and normalized νmax resulting from (4). Top: values obtained from the MCMC analyses. The color code indicates the apparent magnitude of the target: mv < 10 (black) and mv > 10 (gray). The star symbol represents the index derived for the Sun based on VIRGO green channel observations: αg = 1.26 with σW = 5 ppm. The square symbol represents the index obtained after adding a HF noise level (corresponding to that seen in Kepler observations of the Sun-like star KIC 3427720) to the VIRGO subseries. Bottom: values obtained after interpolation that corresponds to a HF level of σW = 30 ppm (see Sect. 4.3). The color code indicates here the data with R2 > 0.8 (i.e., the best fits, black) and R2 > 0.5 (blue). The triangle symbol represents the value of the flicker index derived by adding a WGN of σW = 30 ppm in solar VIRGO observations, for which we find: αg = 0.9464. This is the raw level of HF noise we expect for Sun-like stars observed with CHEOPS. Pearson (ρP) and Spearman’s (ρS) coefficients associated with these plots for the best targets (R2 > 0.9) are indicated on each panel.
Current usage metrics show cumulative count of Article Views (full-text article views including HTML views, PDF and ePub downloads, according to the available data) and Abstracts Views on Vision4Press platform.
Data correspond to usage on the plateform after 2015. The current usage metrics is available 48-96 hours after online publication and is updated daily on week days.
Initial download of the metrics may take a while.