Free Access
Fig. 15
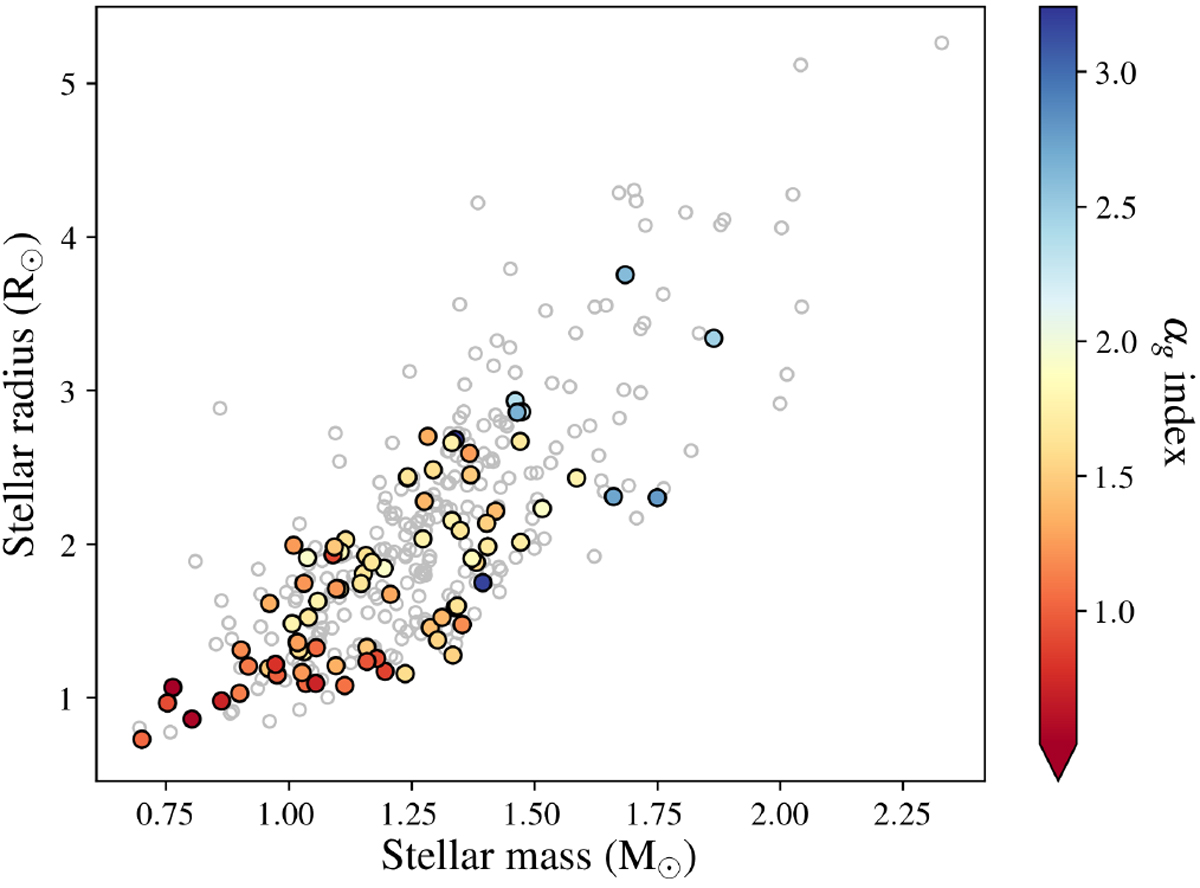
Selected Kepler targets represented as a function of their mass and radius. The color code indicates the inferred index parameters in the frequency region of granulation (αg) derived aftercorrection by the HF noise. The best targets with R2 > 0.9 are shown in color (see Sect. 4.3).
Current usage metrics show cumulative count of Article Views (full-text article views including HTML views, PDF and ePub downloads, according to the available data) and Abstracts Views on Vision4Press platform.
Data correspond to usage on the plateform after 2015. The current usage metrics is available 48-96 hours after online publication and is updated daily on week days.
Initial download of the metrics may take a while.