Fig. 7.
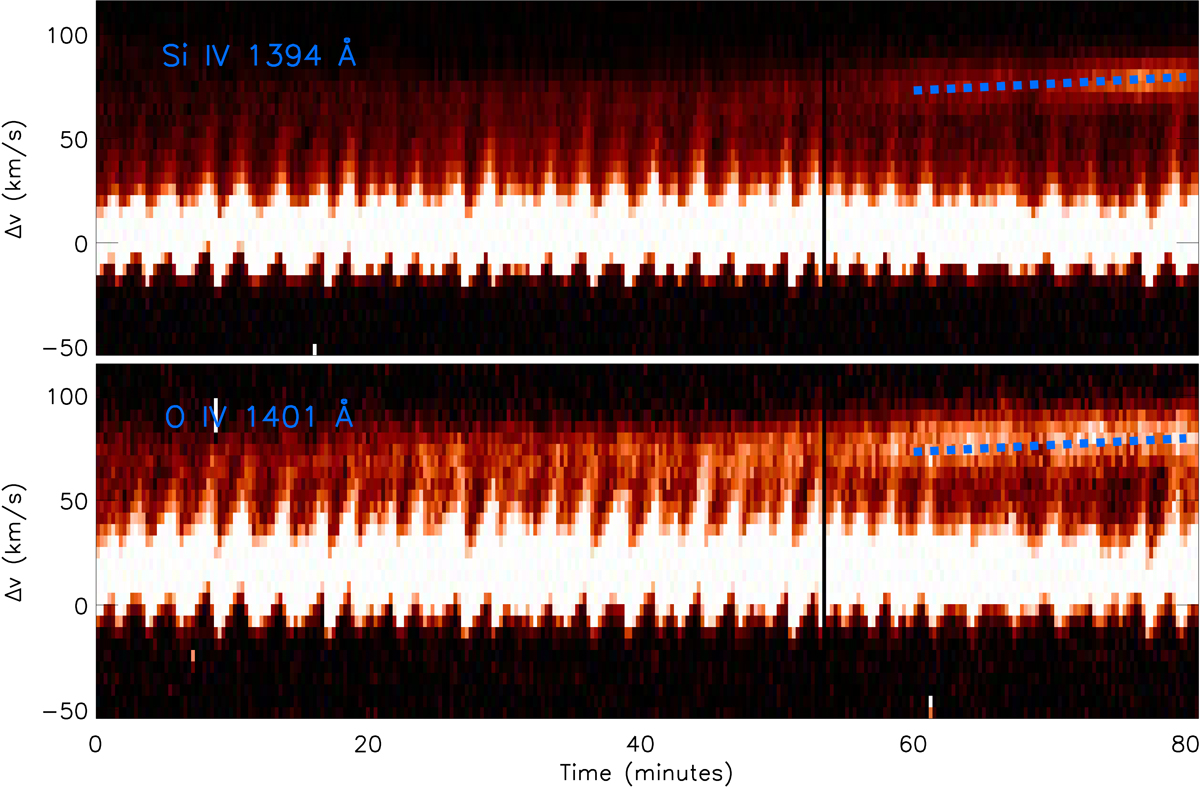
Top row: spectral-time plot for the Si IV 1394 Å line for a pixel within the transition region brightening. The typical saw-tooth shock pattern is clearly evident close to the line core. The supersonic downflow can be detected from around 60 min until the end of the time series. During this time, the flow accelerates at approximately 5 m s−2 from around 73 km s−1 to close to 80 km s−1, as indicated by the dashed blue line. Bottom row: same as the top row except for the O IV 1401 Å line.
Current usage metrics show cumulative count of Article Views (full-text article views including HTML views, PDF and ePub downloads, according to the available data) and Abstracts Views on Vision4Press platform.
Data correspond to usage on the plateform after 2015. The current usage metrics is available 48-96 hours after online publication and is updated daily on week days.
Initial download of the metrics may take a while.