Free Access
Fig. 4.
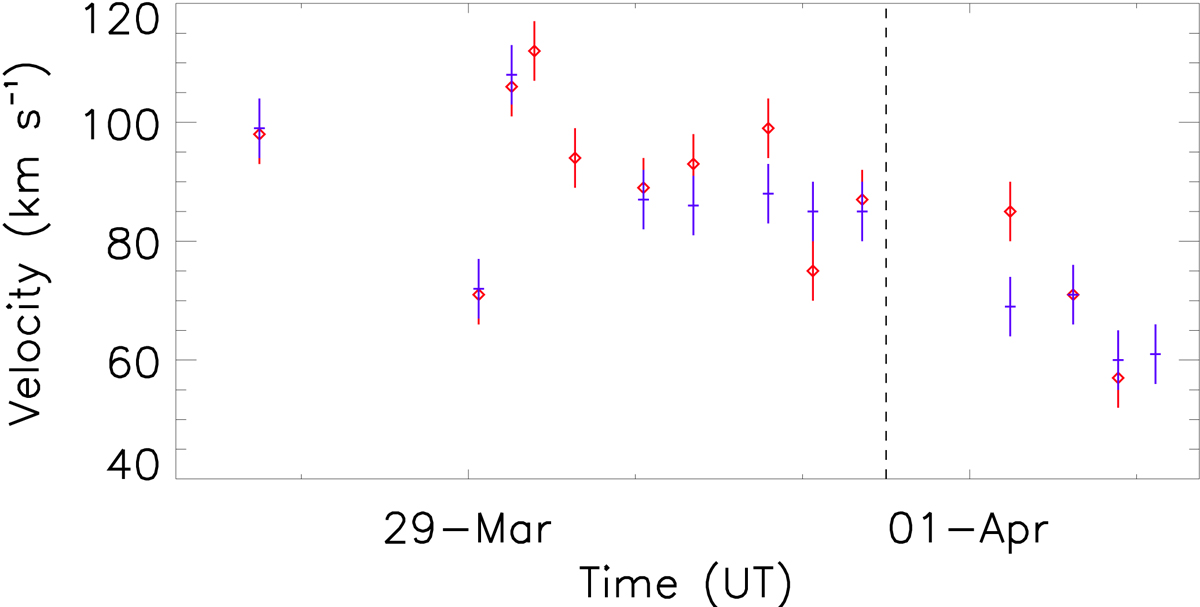
Peak supersonic downflow velocities inferred from the Si IV 1394 Å (red squares) for each raster. The blue crosses indicate the co-spatial O IV 1401 Å downflow velocity. The error bars highlight the spectral sampling and the dashed vertical line indicates the approximate time of the light bridge formation.
Current usage metrics show cumulative count of Article Views (full-text article views including HTML views, PDF and ePub downloads, according to the available data) and Abstracts Views on Vision4Press platform.
Data correspond to usage on the plateform after 2015. The current usage metrics is available 48-96 hours after online publication and is updated daily on week days.
Initial download of the metrics may take a while.