Fig. 2.
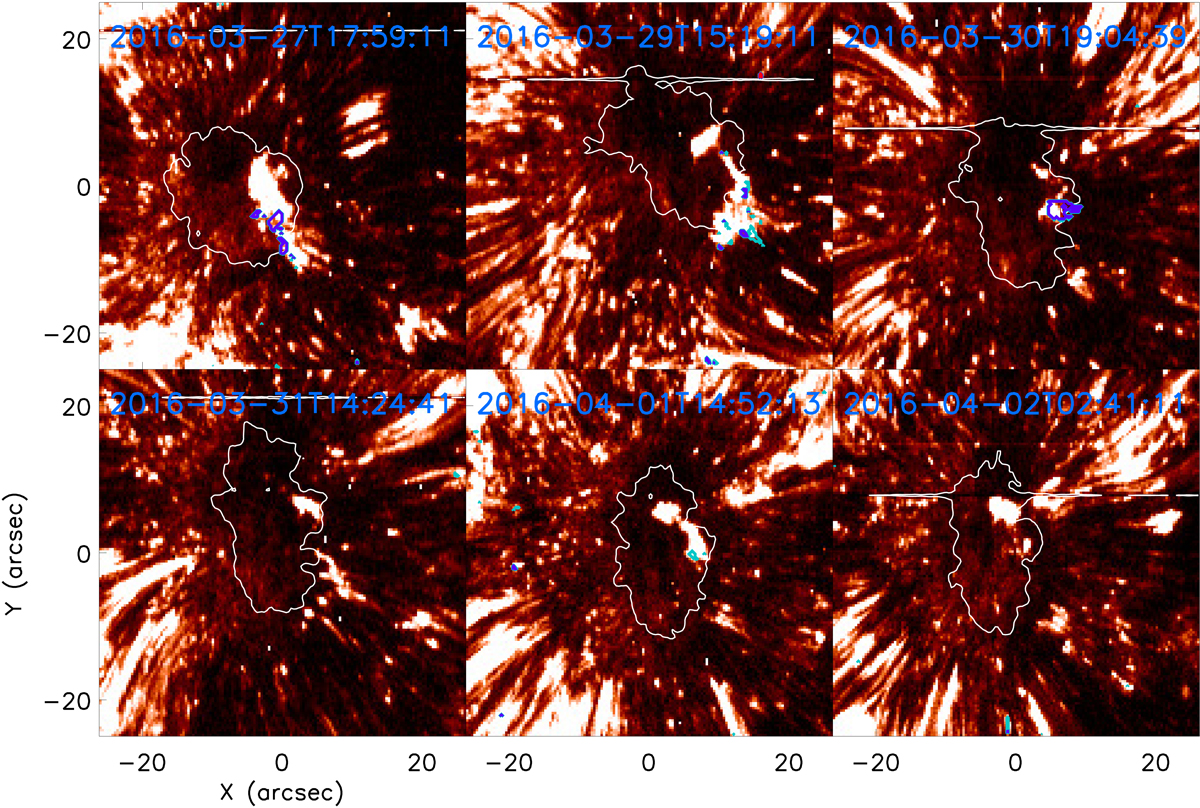
Intensity at the rest wavelength of the Si IV 1394 Å line in the sunspot from the rasters corresponding to the SDO/HMI continuum panels in Fig. 1. The overlaid coloured contours highlight regions where double Gaussian fitting indicated the presence of supersonic downflows (aqua and blue correspond to 50 km s−1 and 75 km s−1, respectively). All supersonic downflows within the sunspot are co-spatial to a sustained region of increased intensity in the line core. Again, pointing coordinates are not relative and are only provided for an indication of scale. The white contours plot the outline of the sunspot as inferred from the average intensity in the continuum between the two Mg II lines. It should be noted that not all rasters covered the entirety of the FOV plotted in Fig. 1, meaning the FOV plotted in this figure is close to but not perfectly aligned with Fig. 1.
Current usage metrics show cumulative count of Article Views (full-text article views including HTML views, PDF and ePub downloads, according to the available data) and Abstracts Views on Vision4Press platform.
Data correspond to usage on the plateform after 2015. The current usage metrics is available 48-96 hours after online publication and is updated daily on week days.
Initial download of the metrics may take a while.