Fig. 6.
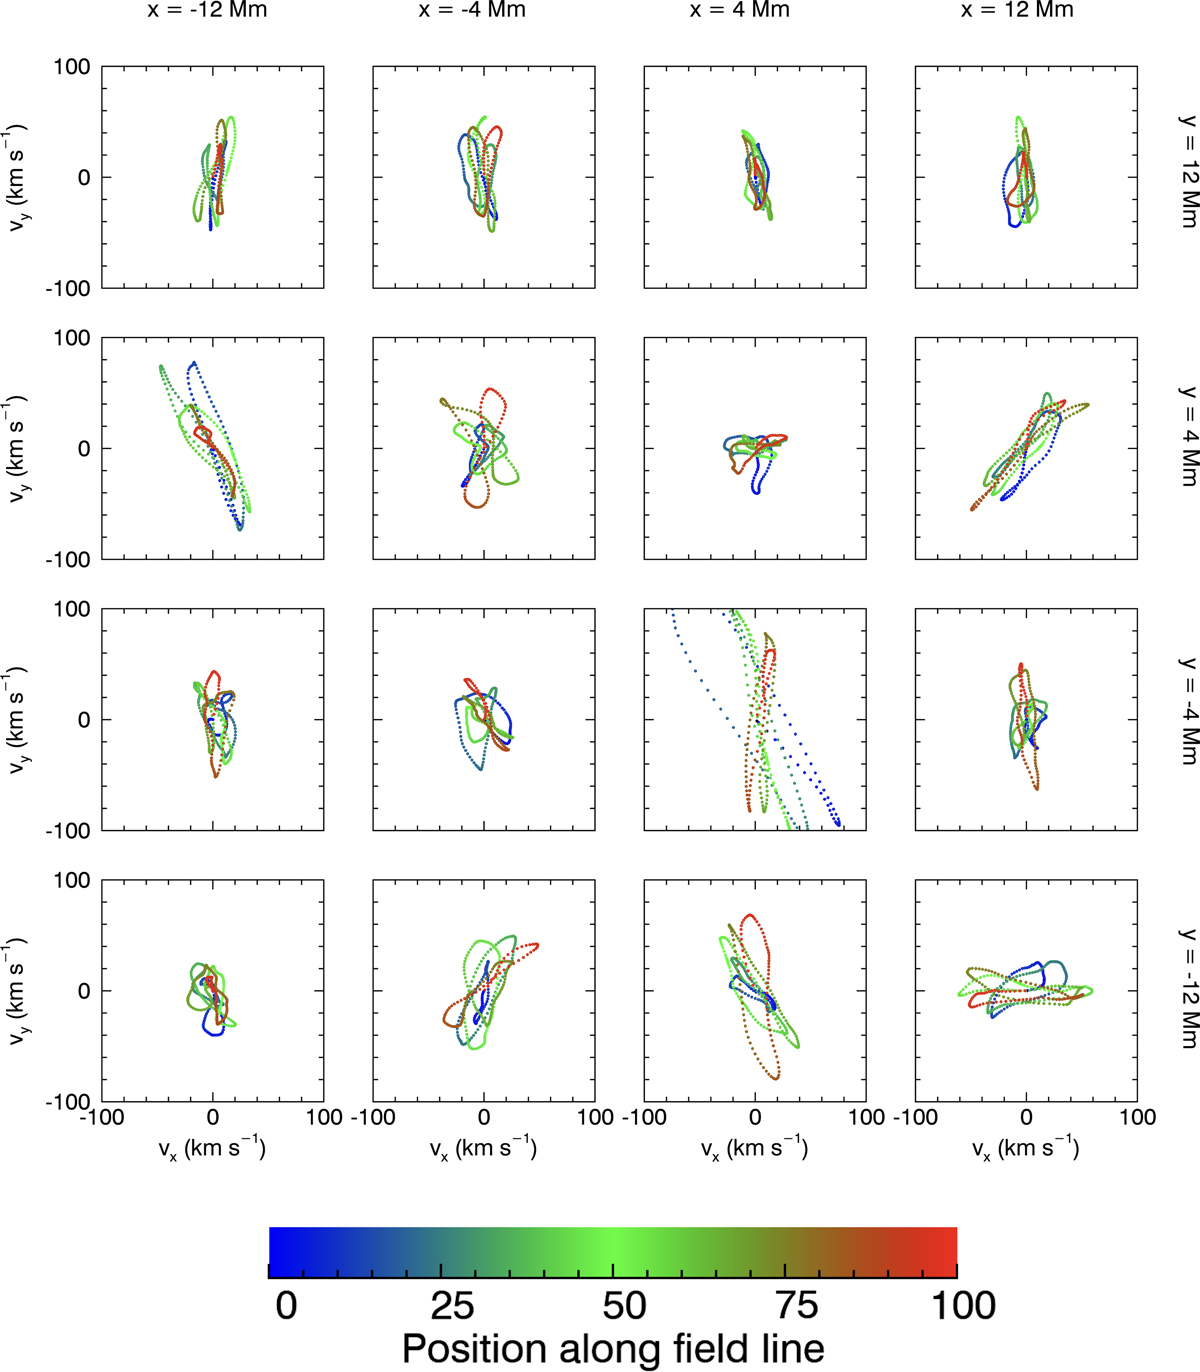
Polarisation of oscillations for different field lines within the domain at t = 1100 s. Sixteen field lines are selected on a grid at positions indicated by the labels at the top and right-hand side of the figure. Three hundred points are selected along each field line and depicted with a colour that shows their position along the field line as a percentage of the total field line length. In order to show the direction of polarisation, the horizontal velocity (vy against vx) is shown for each point. Notice the large resonance for row 3 column 3.
Current usage metrics show cumulative count of Article Views (full-text article views including HTML views, PDF and ePub downloads, according to the available data) and Abstracts Views on Vision4Press platform.
Data correspond to usage on the plateform after 2015. The current usage metrics is available 48-96 hours after online publication and is updated daily on week days.
Initial download of the metrics may take a while.