Fig. 19.
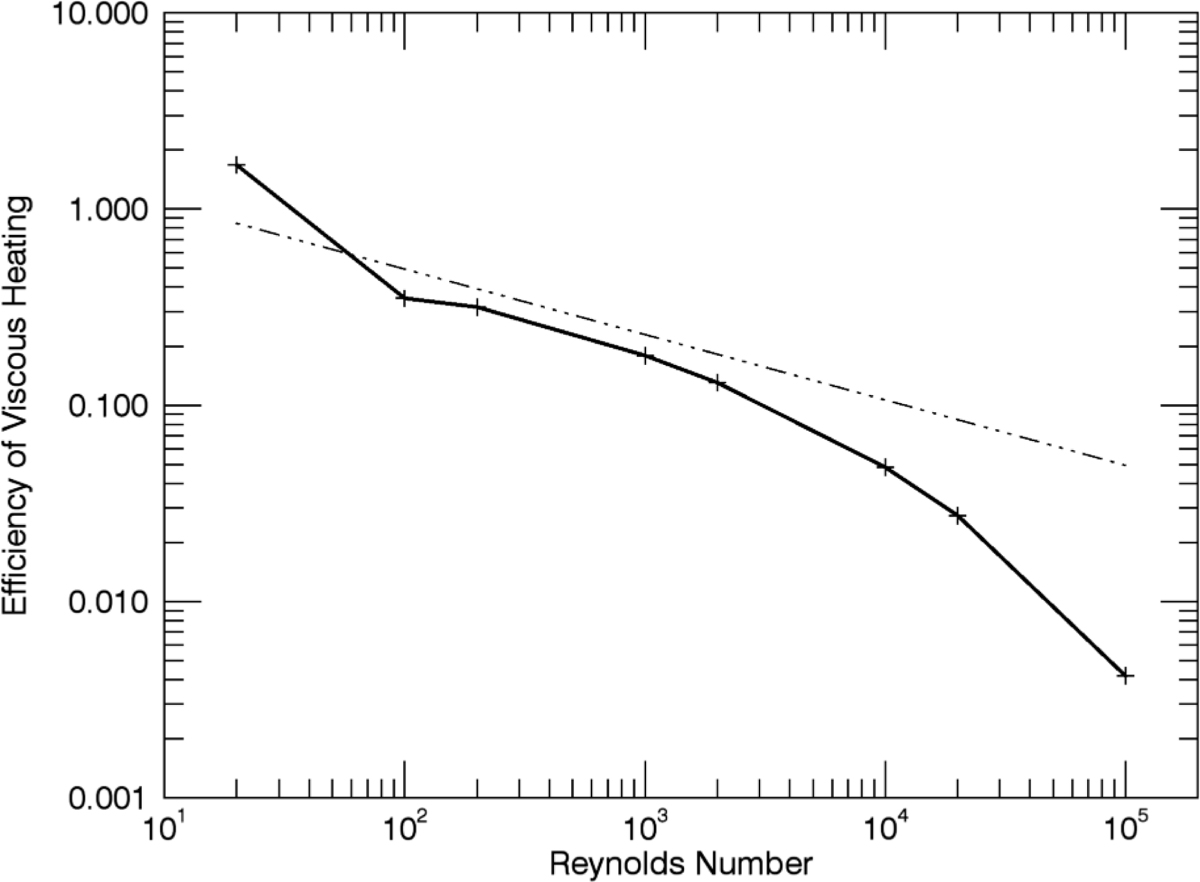
Rate of conversion from mechanical (kinetic and perturbed magnetic) energy to thermal energy at t = 2400 s. The solid line shows the percentage of mechanical energy that is being dissipated every second for simulations with different Reynolds numbers. The dot-dashed line shows the gradient which should be obtained if the heating efficiency scales with ![]() .
.
Current usage metrics show cumulative count of Article Views (full-text article views including HTML views, PDF and ePub downloads, according to the available data) and Abstracts Views on Vision4Press platform.
Data correspond to usage on the plateform after 2015. The current usage metrics is available 48-96 hours after online publication and is updated daily on week days.
Initial download of the metrics may take a while.