Fig. B.2
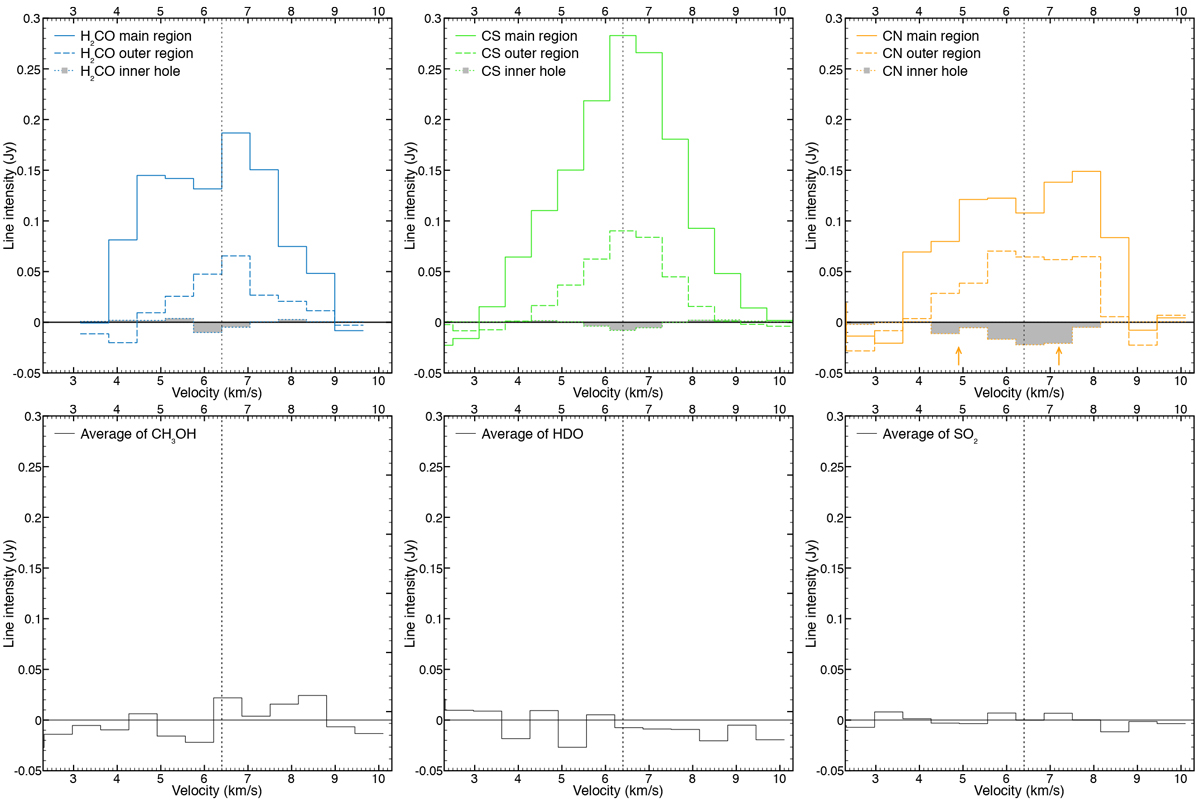
Spectral line profiles. Lines in the first row (detected) are integrated over three rings at different radii: 0′′ –0.2′′ (the inner hole), 0.5′′–2.0′′ (the main region), and 3.5′′–4.5′′ (the outer region). The shaded region highlights the profile from the inner hole. Arrows on the CN line profile denote the presence of blended lines. For lines in the second row (undetected) only the profile over the main region is shown. For these lines, the profile is obtained by averaging all available lines for that species. The vertical line indicates the systemic velocity of the source (6.4 km s−1).
Current usage metrics show cumulative count of Article Views (full-text article views including HTML views, PDF and ePub downloads, according to the available data) and Abstracts Views on Vision4Press platform.
Data correspond to usage on the plateform after 2015. The current usage metrics is available 48-96 hours after online publication and is updated daily on week days.
Initial download of the metrics may take a while.