Fig. B.1
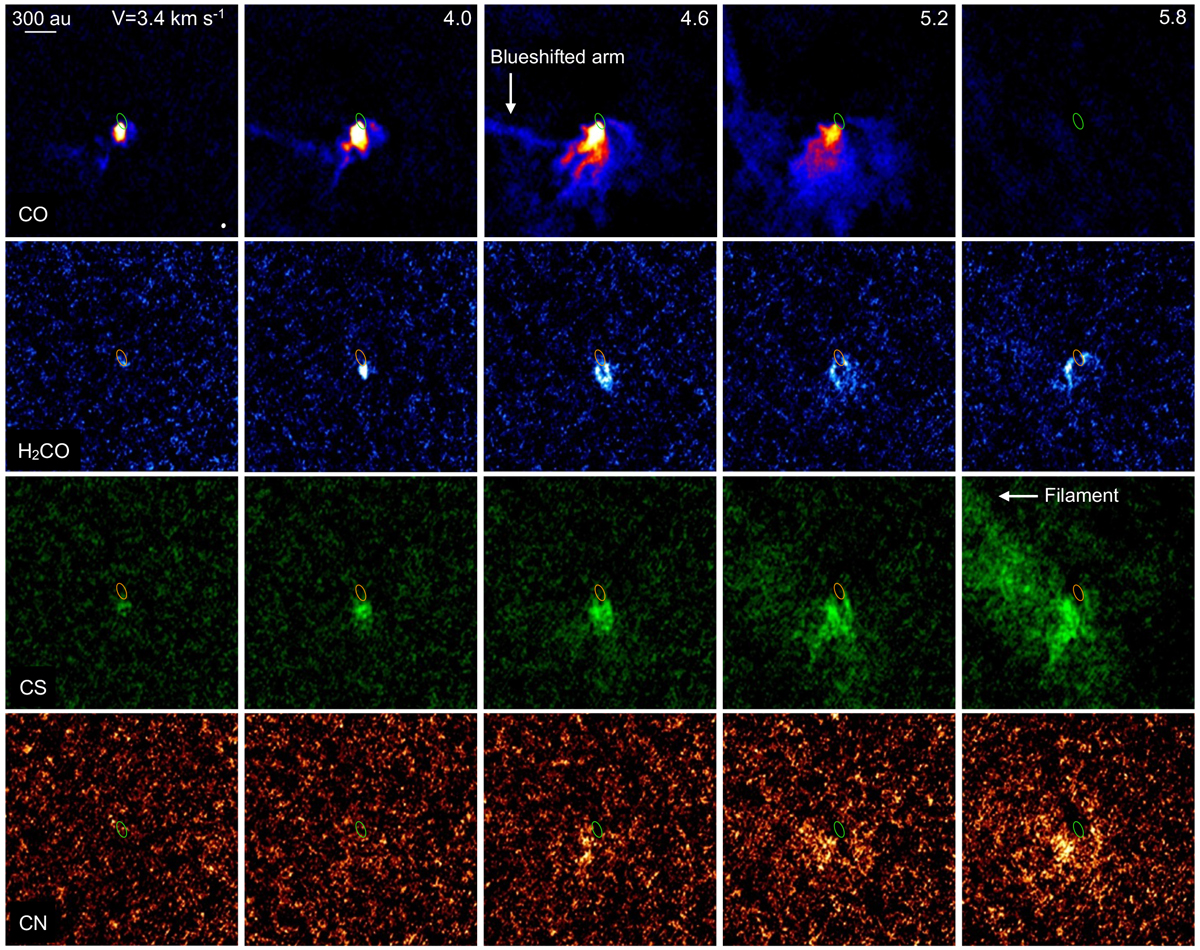
Channel maps of the molecular emission. The H2CO line is shown along the first and fourth rows, the CS along the second and the fifth rows, and the CN along the third and the sixth rows. The inner ellipse indicate the innermost contour of the continuum emission from Fig. 1 (100 σ significance). The beam size of all images is shown in the bottom left corner of the first panel. North is up, east is left.
Current usage metrics show cumulative count of Article Views (full-text article views including HTML views, PDF and ePub downloads, according to the available data) and Abstracts Views on Vision4Press platform.
Data correspond to usage on the plateform after 2015. The current usage metrics is available 48-96 hours after online publication and is updated daily on week days.
Initial download of the metrics may take a while.