Fig. 4
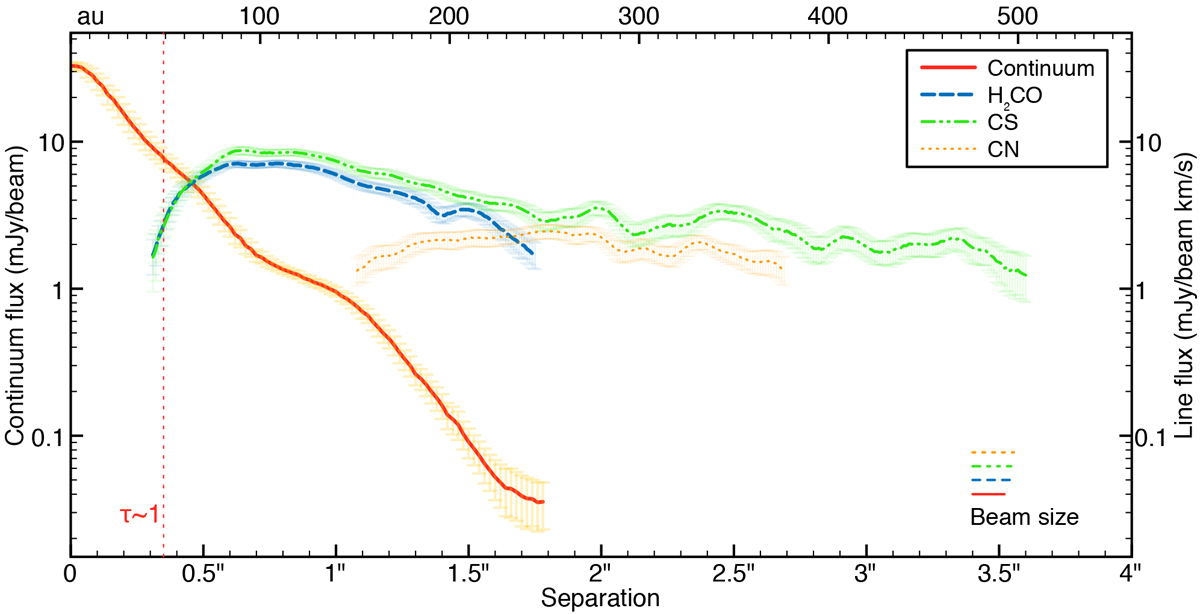
Radial profile of continuum and spectral line emission, obtained from the azimuthal average of a disk with 12° opening angle. Continuum and H2CO emission is from the disk only, while that of CS and CN is also from the outflow cavity. Error bars are obtained by propagating the uncertainties at all angles and do not include the dispersion of the averaged sample. Only fluxes above 3σ confidence are shown. The vertical line indicates the extent over which the continuum emission is optically thick (see Sect. 3.3).
Current usage metrics show cumulative count of Article Views (full-text article views including HTML views, PDF and ePub downloads, according to the available data) and Abstracts Views on Vision4Press platform.
Data correspond to usage on the plateform after 2015. The current usage metrics is available 48-96 hours after online publication and is updated daily on week days.
Initial download of the metrics may take a while.