Fig. 2
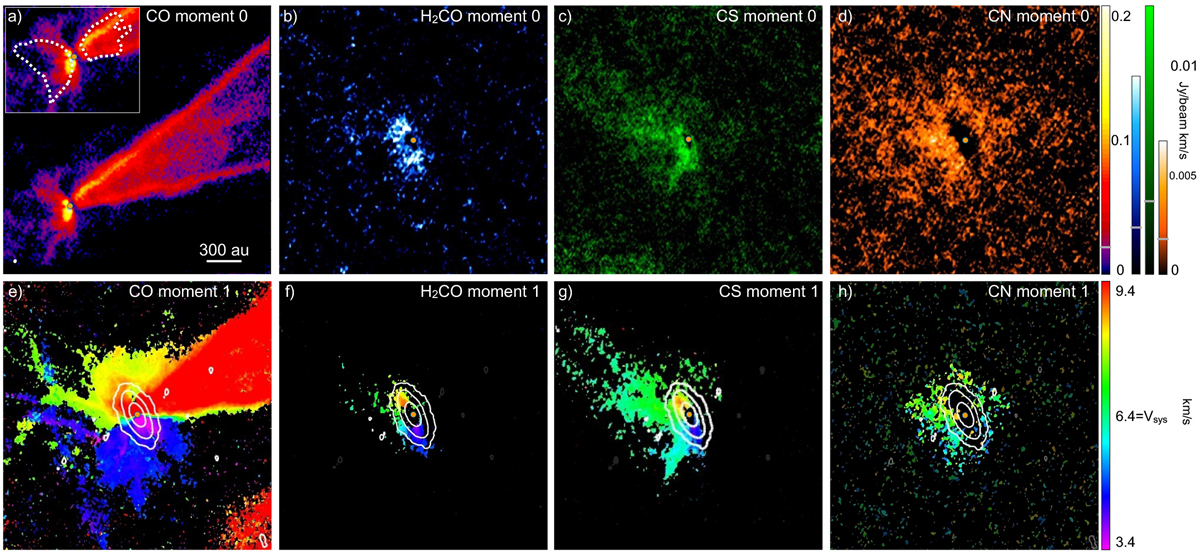
Line maps from DG Tau B. (a) CO moment 0. Dashed contours in the inset image define the scattered light from HST (Padgett et al. 1999). (b) H2CO moment 0. (c) CS moment 0. (d) CN at 226.87 GHz moment 0. (e) CO moment 1. (f) H2CO moment 1. (g) CS moment 1. (h) CN at 226.87 GHz moment 1. Fluxes at 3σ confidence are indicated by the gray notch on the color bars. All moment 1 maps are obtained by clipping fluxes below 3σ and are shown with the same spatial scale. Contours on these maps are the 100σ, 25σ, and 3σ of the continuum map (Fig. 1). The stellar position is indicated by the central orange dot (offset from the center in panel a). The beam size of all images is shown to the bottom left of (a). North is up,east is left.
Current usage metrics show cumulative count of Article Views (full-text article views including HTML views, PDF and ePub downloads, according to the available data) and Abstracts Views on Vision4Press platform.
Data correspond to usage on the plateform after 2015. The current usage metrics is available 48-96 hours after online publication and is updated daily on week days.
Initial download of the metrics may take a while.