Fig. 2.
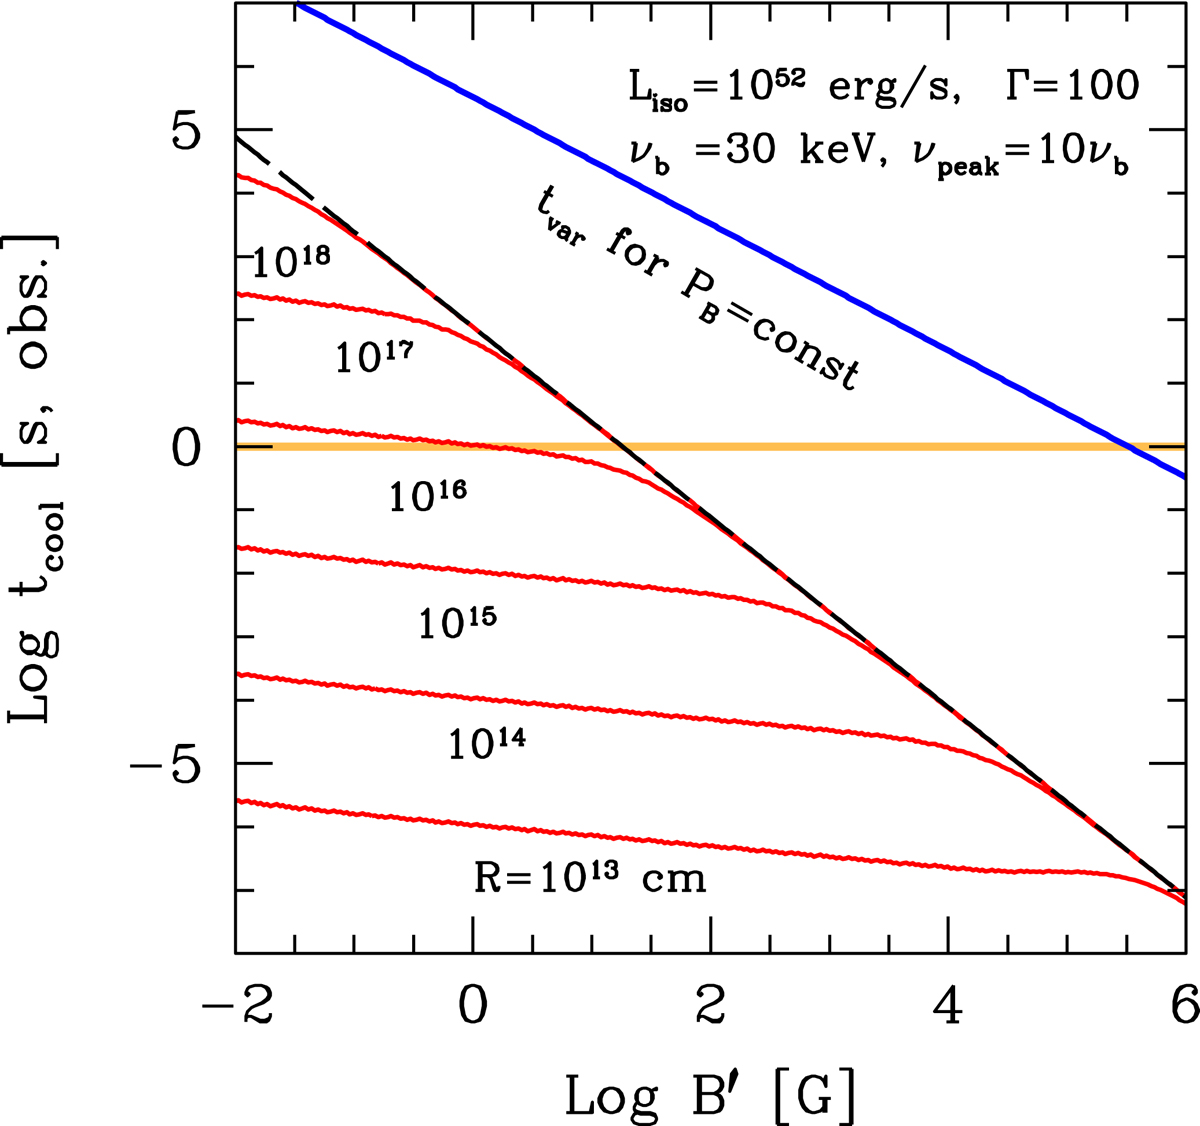
Observed cooling timescale for the electrons emitting at the break frequency νb as a function of the magnetic field and for different distances from the central engine. It is assumed that particles cool via synchrotron and self-Compton processes (considering, for the latter, only the fraction of the synchrotron spectrum below hν/(mec2) = 1/γb). The black dashed line indicates the synchrotron cooling timescale only. The blue line is the minimum variability timescale found by assuming that the Poynting flux remains constant beyond the acceleration phase, leading to B′ ∝ R−1 (see Sect. 3). As reference, a redshift z = 1 has been considered. The orange horizontal line corresponds to a typical exposure time of 1 s.
Current usage metrics show cumulative count of Article Views (full-text article views including HTML views, PDF and ePub downloads, according to the available data) and Abstracts Views on Vision4Press platform.
Data correspond to usage on the plateform after 2015. The current usage metrics is available 48-96 hours after online publication and is updated daily on week days.
Initial download of the metrics may take a while.