Fig. 1.
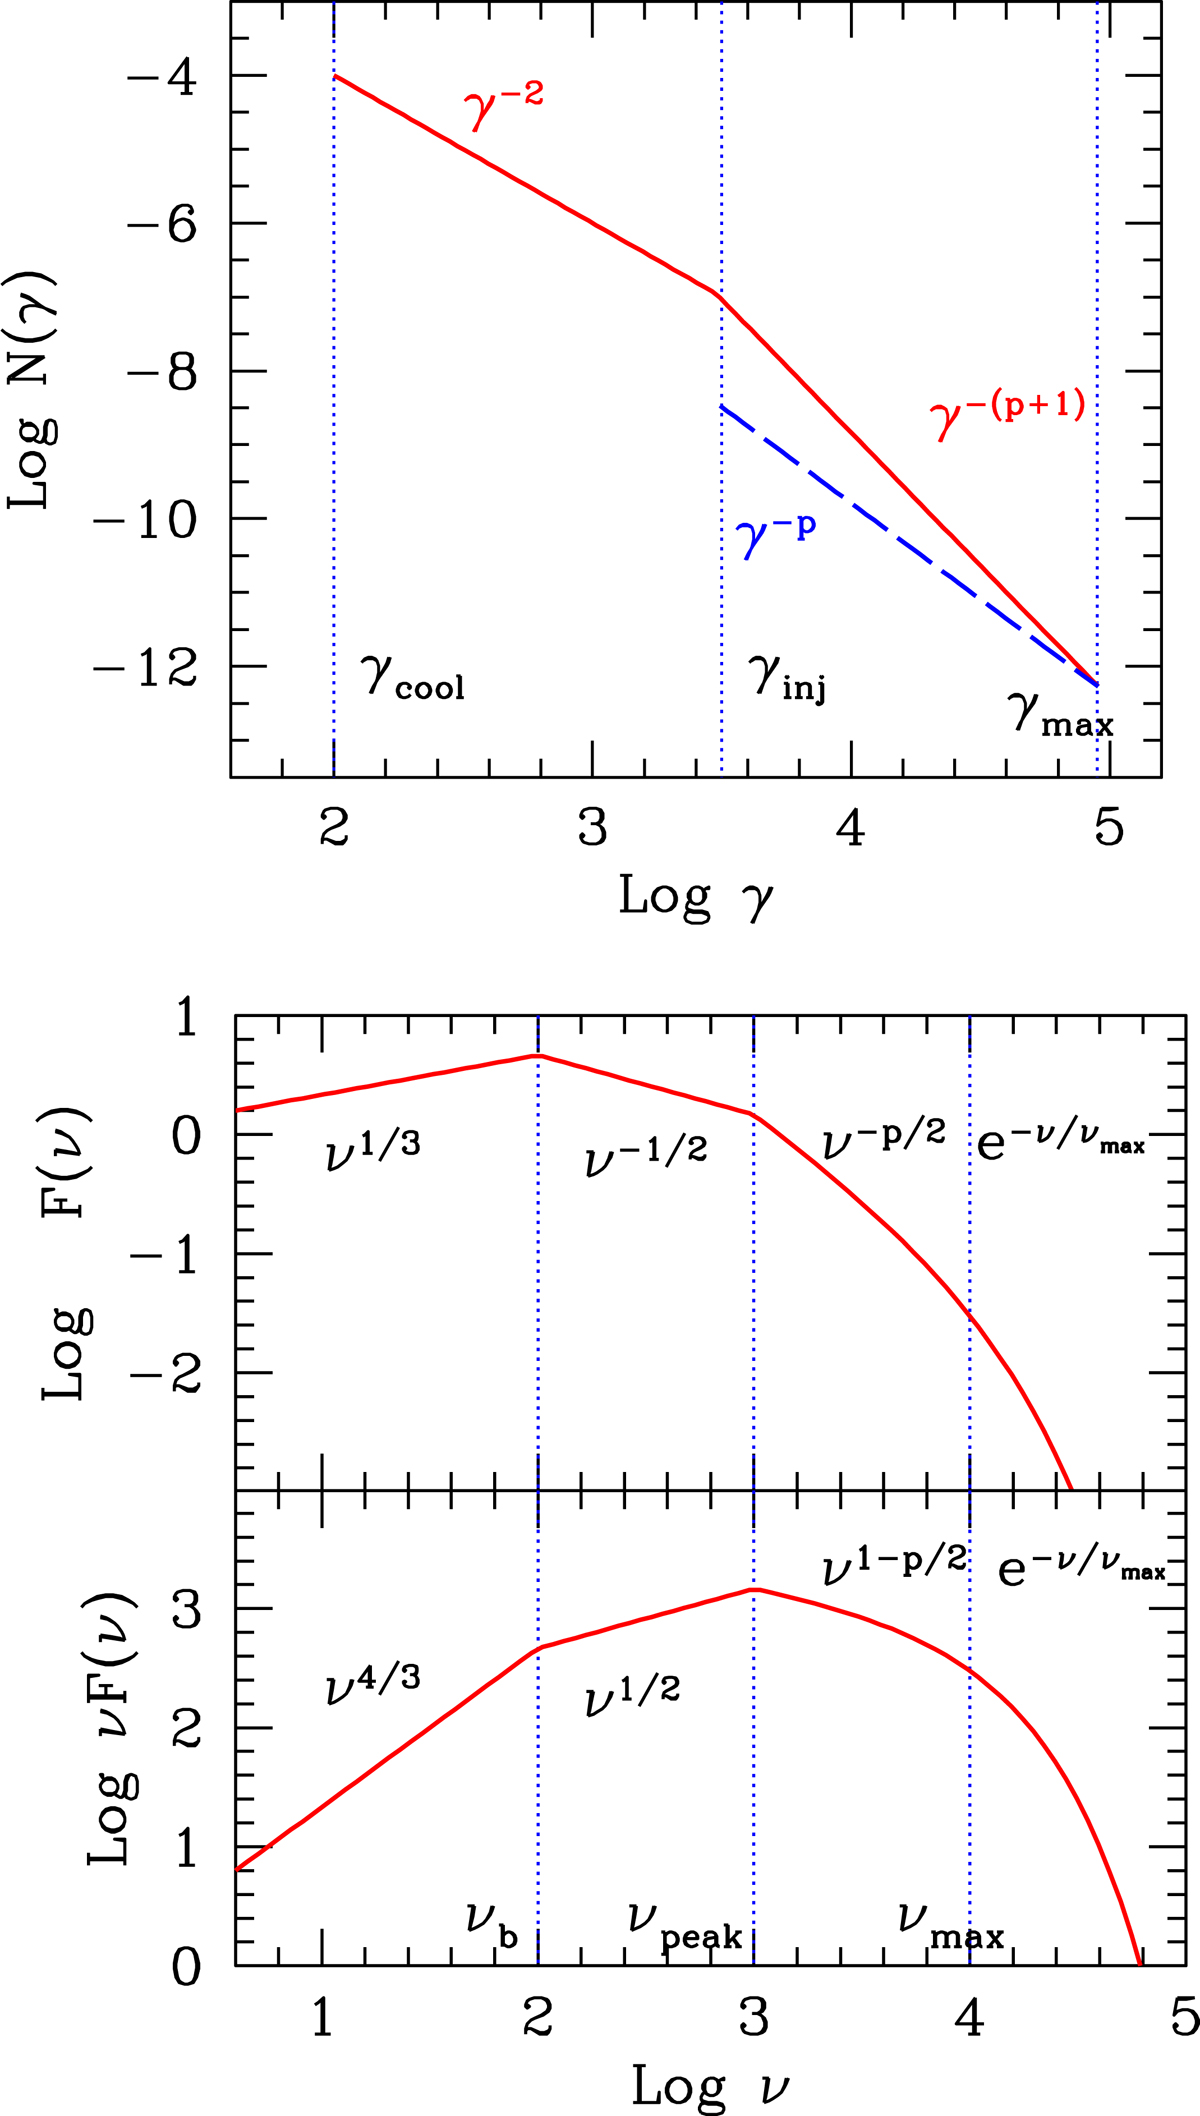
Top panel: schematics of the particle distribution responsible for the spectra of the bottom two panels. The dashed blue line corresponds to the injected [Q(γ)] distribution. The characteristic Lorentz factors and frequencies are labelled as described in the text. The solid and dashed lines are re–scaled by an arbitrary amount. Bottom two panels: sketch of synchrotron spectra as reproduced by the spectral analysis discussed in the text. The spectra show a high-energy exponential cut-off which is not always present or detectable in real data.
Current usage metrics show cumulative count of Article Views (full-text article views including HTML views, PDF and ePub downloads, according to the available data) and Abstracts Views on Vision4Press platform.
Data correspond to usage on the plateform after 2015. The current usage metrics is available 48-96 hours after online publication and is updated daily on week days.
Initial download of the metrics may take a while.