Fig. 5.
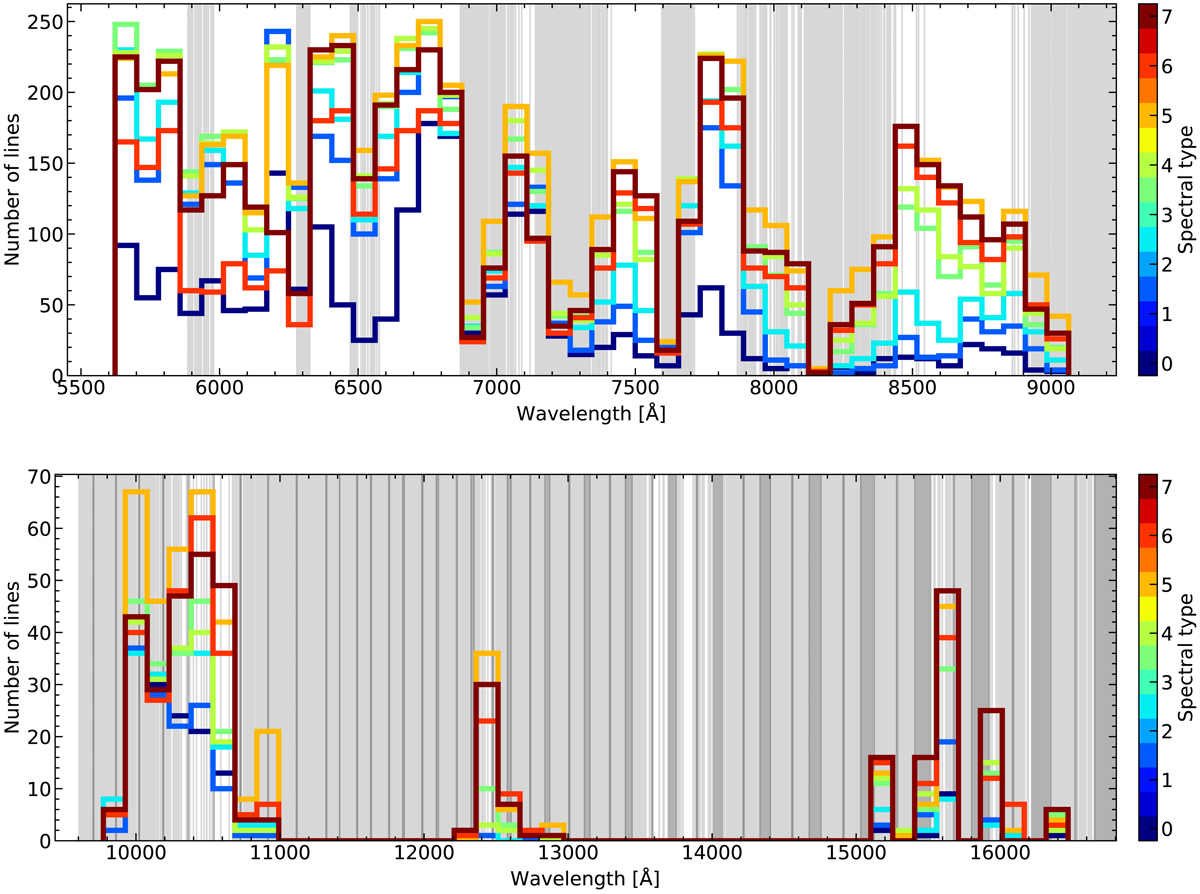
Histogram of the line wavelengths of the masks used to compute the CCFs of the low v sin i targets for the VIS (top) and NIR (bottom) channels. Different colours correspond to the different spectral types of the targets used to build the masks (see targets and number of lines in Table 3). Light grey areas correspond to regions affected by telluric features, which are broadened by ±30 km s−1. Dark grey hatched areas correspond to regions without spectral information in the CARMENES data, corresponding to gaps between consecutive spectral orders (redwards of 11 500 Å), and intra-order gaps in the NIR detector mosaic.
Current usage metrics show cumulative count of Article Views (full-text article views including HTML views, PDF and ePub downloads, according to the available data) and Abstracts Views on Vision4Press platform.
Data correspond to usage on the plateform after 2015. The current usage metrics is available 48-96 hours after online publication and is updated daily on week days.
Initial download of the metrics may take a while.