Fig. 4.
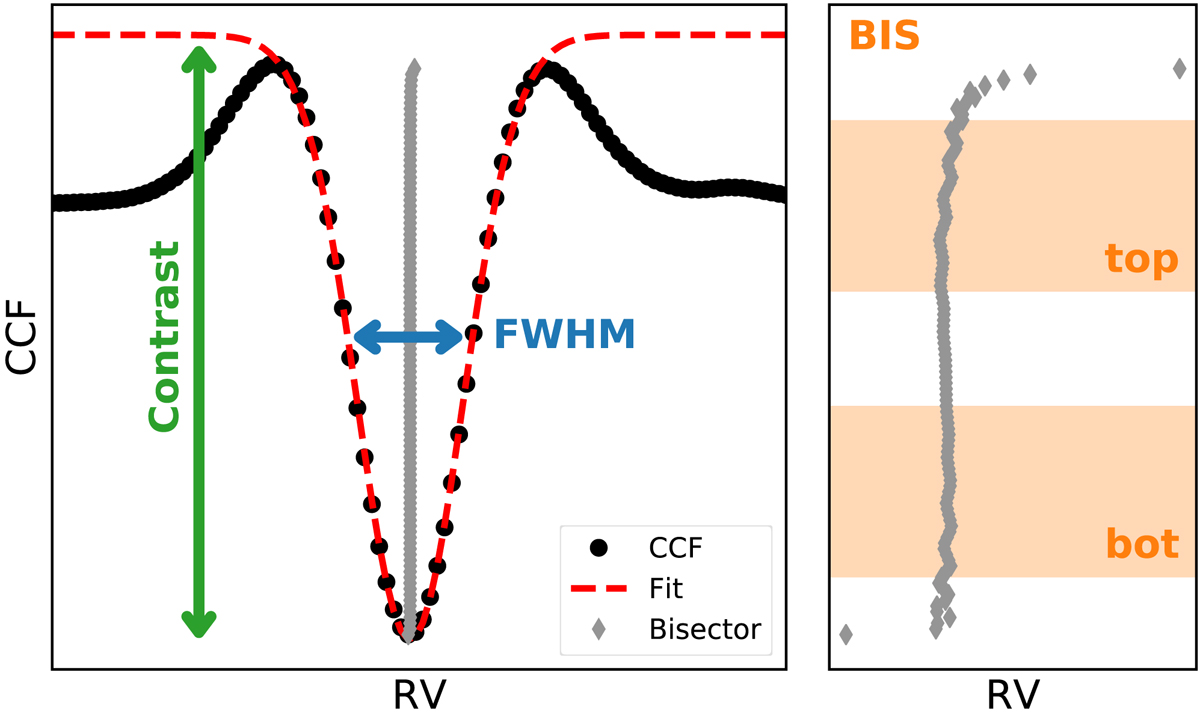
Illustration of the CCF activity parameters measured in this work. We plotted a typical CCF of an M dwarf (black dots) and the best Gaussian fit (red dashed line) together with the FWHM and contrast derived from the fit (left). We also plotted the bisector of the CCF (grey diamonds) and a zoom to the central region of the CCF to show the bisector shape (right). We indicate the top and bottom regions used to compute the BIS.
Current usage metrics show cumulative count of Article Views (full-text article views including HTML views, PDF and ePub downloads, according to the available data) and Abstracts Views on Vision4Press platform.
Data correspond to usage on the plateform after 2015. The current usage metrics is available 48-96 hours after online publication and is updated daily on week days.
Initial download of the metrics may take a while.